All published articles of this journal are available on ScienceDirect.

Bone Mineral Density at Distal Forearm in Women in Mae Chaem District, Chiang Mai Province, Thailand: A Cross-Sectional Study
Authors Info & Affiliations
Abstract
Background:
Osteoporosis is a common health problem worldwide and has a high impact on quality of life and economic losses. However, having an early risk assessment can resolve the problem.
Objective:
To investigate the prevalence of bone mineral density (BMD) and osteoporosis in the distal forearm among Thai women in Mae Chaem District, Chiang Mai Province, Thailand.
Methods:
The subjects were 456 women, aged between 24-88 years who inhabit Mae Chaem District, Chiang Mai Province, Thailand. The demographic characteristics data was obtained by using self-administered questionnaires that determine common risk factors for osteoporosis. The BMD of the non-dominant distal forearm of all subjects was determined according to standard protocol by use of peripheral dual energy X-ray absorptiometry (pDEXA) scanning.
Results:
The BMD decreased as a function of age (Pearson's r = -0.645) while the BMD increased as a function of weight (Pearson's r = 0.389), and height (Pearson's r = 0.267). The percentage of prevalence is increased as a function of age-group in osteoporosis group, while it is decreased in that of normal bone density. In addition, the BMD at distal forearm decreased when the duration of menopause increased (Pearson's r = -0.455)
Conclusion:
The prevalence of osteoporosis was found in the women who reside in Mae Chaem District, Chiang Mai Province, Thailand. The current study will provide the information to guide the strategies for preventing osteoporosis in the population.
1. INTRODUCTION
Osteoporosis is a common health problem in the world, characterized by a systemic impairment of bone mineral density (BMD) and micro-architectural deterioration that causes an increase in bone fragility and fractures [1, 2]. These bone fractures most frequently occur in the spine, hip, femur, or wrist. These fractures are associated with consequences such as loss of mobility and diminished quality of life. Also, there are increases in morbidity and mortality occurring in osteoporosis patients [3-5]. According to the World Health Organization (WHO), there are up to 49 million people who meet the criteria for osteoporosis in various countries such as North America, Europe, Japan, and Australia [6]. In addition, osteoporosis is affecting more than 37.5 million individuals in the USA and European Union [7]. There are several studies that have studied BMD in both men and women in different ethnicities and countries. It is possible that race or ethnicity contributes to BMD [8-16]. In addition, other risk factors also contribute to the prevalence of osteoporosis including physical body, behaviors and nutritional status [6, 17]. Hence, the populations in each of these countries, or different areas of the same country have dissimilar incidents of osteoporosis.
Although, BMD at the spine, hip, and femur is generally used for osteoporosis evaluation, the forearm is a good indicator of losses in bone density occurring at the peripheral skeleton, as well [18-24].
In this current study, we focused on the prevalence of BMD, osteopenia, and osteoporosis in the distal forearm of Thai women who reside in Mae Chaem District, Chiang Mai Province, Thailand. In addition, BMD in the distal forearm of postmenopausal women were included in this current study because osteoporosis is commonly considered as a post menopause disease in women.
2. MATERIALS AND METHODS
The study was carried out in seven sub-districts of Mae Chaem District, located about 155.5 kilometers southwest of Chiang Mai city, Chiang Mai Province, Thailand. This study was performed under the Community Services Project at Mae Chaem District, Chiang Mai Province, Thailand by the Department of Radiologic Technology, Faculty of Associated Medical Sciences, Chiang Mai University, Thailand.
2.1. Subjects and Demographic Characteristics Data
A total of 456 women, aged between 24-88 years who reside at Mae Chaem District, Chiang Mai Province, Thailand, was evaluated in this study. The demographic characteristics data was obtained by using self-administered questionnaires that focused on common risk factors for osteoporosis. This risk factors were osteoporosis fixed risks (i.e. age, height, weight, parent’s history of osteoporosis, parent’s history of spinal deformity), and osteoporosis modifiable risks (i.e.; coffee/tea intake, alcohol intake, smoking, milk intake, eating habits, and exercise). The body mass index (BMI) was calculated using the following equation: BMI = weight, kg / (height, m)2.
2.2. Determination of Bone Mineral Density (BMD) in Distal Forearm
The BMD of the non-dominant distal forearm of all subjects was determined based on standard protocol using peripheral dual energy X-ray absorptiometry (pDEXA) scans (EXA 3000; Osteosys Corp, Seoul, Korea).
Subject preparation: All subjects were requested to remove all items (e.g. bracelet, wristwatch, rings, etc.) from their non-dominant distal forearm before BMD measurement.
Positioning: A non-dominant distal forearm with a lateral position was placed between the X-ray source and detector of pDEXA machine. All subjects were asked to not move until BMD scanning was completed.
The osteoporosis diagnosis was based on the World Health Organization (WHO) criteria: Normal bone mass (T-score ≥ -1), osteopenia (T-score between -1 and -2.5), and osteoporosis (T-score ≤ -2.5). The T-score was calculated as following; T-score = (Measured BMD - Mean BMD of a healthy young adult) / Standard deviation of young adult BMD. However, the T-score was auto-calculated by the pDEXA machine.
2.3. Statistical Analysis
The data was shown as an average ± standard deviation (SD). Linear correlation analysis was carried out using Pearson correlation. The Student’s t-test was used independently to evaluate statistical differences in the mean values between two groups. A p value of < 0.05 was considered statistically significant.
3. RESULTS
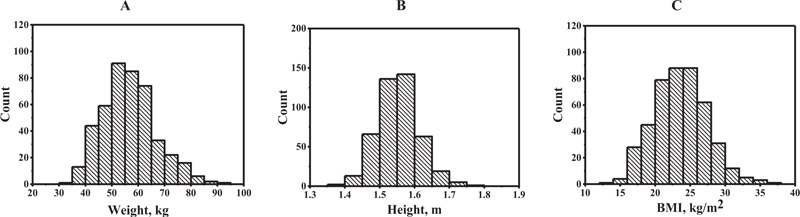
The histograms of the risk factors weight, height, and BMI showed an almost symmetric distribution as indicated in Fig. (1). Table 1 shows the demographic characteristics data of the subjects in this study. The height, weight, and body mass index (BMI) of all subjects were compared among the various age groups. As for the height, the difference was statistically significant (p < 0.05) among the 60-69 and 70-88 year-old groups when compared with the 24-39 year-old groups. As for the weight, the difference was statistically significant (p < 0.05) among the 50-59, 60-69, and 70-88 year-old groups when compared with the 40-49 year-old groups. Similar with the weight, BMI among the 60-69 and 70-88 year-old groups was found to be statistically significant (p < 0.05) when compared with the 40-49 year old groups. The relative ordering of prevalence of osteoporosis modifiable risks was eating habits (fish, beans, and vegetables), milk intake, exercise, coffee/tea intake, smoking, and alcohol intake, respectively, as shown in Table 2.
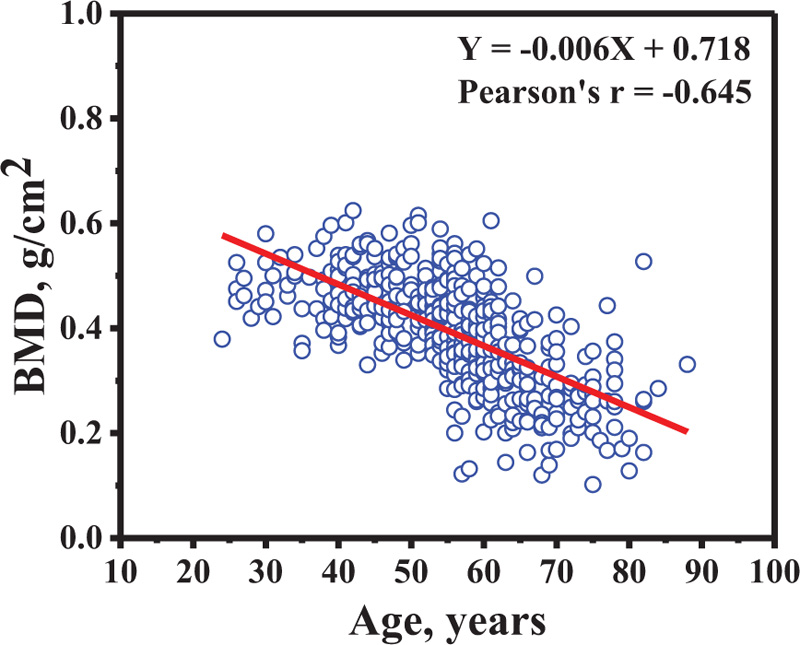
Table 3 shows the distal forearm BMD and t-scores for different age groups. The highest and lowest average of distal forearm BMD was found in the 24-39 and 70-88 year-old group, respectively. The highest and lowest average distal forearm T-scores were also found in the 24-39 and 70-88 year-old groups, respectively. Of note, the 70-88 year-old group showed an average T-score (average T-score = -3.373 ± 1.239) that was lower than the osteoporosis threshold (T-score ≤ -2.5). In addition, the relation between BMD in distal forearm and age is shown in Fig. (2). The BMD decreased as a function of age (Pearson's r = -0.645). The multiple regression model was applied to the data. The model was following; Y=(-0.005)X1 + 0.002X2 + (-0.02)X3 + 0.586 ; When Y was BMD and X1, X2 and X3 were age, weight and height. Whereas, the simple regression model for age was following; Y = (-0.006)X1 + 0.718 ; When Y was BMD and X1 was age. The result showed that the regression coefficient from both multiple regression and simple regression models were similar in age. It could suggest that the mean change in the BMD in a year change age.
| 24-39 | 40-49 | 50-59 | 60-69 | 70-88 | |
|---|---|---|---|---|---|
| Age (years) | 33.19 ± 4.62 |
44.56 ± 2.95 |
55.18 ± 2.47 |
63.50 ± 2.89 |
75.04 ± 4.19 |
| Height (cm) | 155.83 ± 5.45 |
151.30 ± 29.13 |
153.60 ± 13.27 |
148.30 ± 29.28 I |
146.75 ± 20.87 I, III |
| Weight (kg) | 56.46 ± 9.73 |
59.99 ± 9.24 |
57.51 ± 9.77 II |
54.53 ± 10.06 II, III |
48.40 ± 7.94 I, II, III, IV |
| BMI (kg/m2) | 23.23 ± 3.73 |
24.46 ± 3.57 |
24.08 ± 3.74 |
23.09 ± 3.98 II, III |
21.33 ± 4.40 I, II, III, IV |
II = value was statistically significant difference from the 40–49 years group (p < 0.05)
III = value was statistically significant difference from the 50–59 years group (p < 0.05)
IV = value was statistically significant difference from the 60–69 years group (p < 0.05)
(The Student’s t-test was used independently to evaluate statistical differences in the mean values between two groups.)
| Risk Factors | Prevalence (%) |
|---|---|
| Parent history of osteoporosis or low-trauma fractures | 19.4 |
| Parent history of spinal deformity | 18.5 |
| Coffee/tea intake | 30.3 |
| Alcohol intake | 7.0 |
| Smoking | 10.7 |
| Milk intake | 63.6 |
| Eating habits (fish, beans, and vegetable) | 99.3 |
| Exercise | 63.2 |
| Age Group (years) | n | Distal Forearm BMD (g/cm2) | Distal Forearm T-Score |
|---|---|---|---|
| 24-39 | 36 | 0.474 ± 0.058 | -0.036 ± 0.959 |
| 40-49 | 88 | 0.469 ± 0.063 | -0.141 ± 1.049 |
| 50-59 | 166 | 0.413 ± 0.086 I, II | -1.099 ± 1.496 I, II |
| 60-69 | 111 | 0.328 ± 0.091 I, II, III | -2.462 ± 1.460 I, II, III |
| 70-88 | 55 | 0.271 ± 0.079 I, II, II, IV | -3.373 ± 1.239 I, II, II, IV |
II = value was statistically significant difference from the 40–49 years group (p < 0.05).
III = value was statistically significant difference from the 50–59 years group (p < 0.05).
IV = value was statistically significant difference from the 60–69 years group (p < 0.05).
(The Student’s t-test was used independently to evaluate statistical differences in the mean values between two groups).
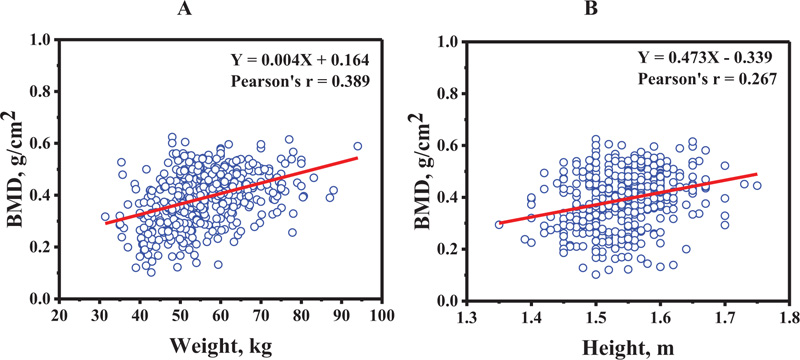
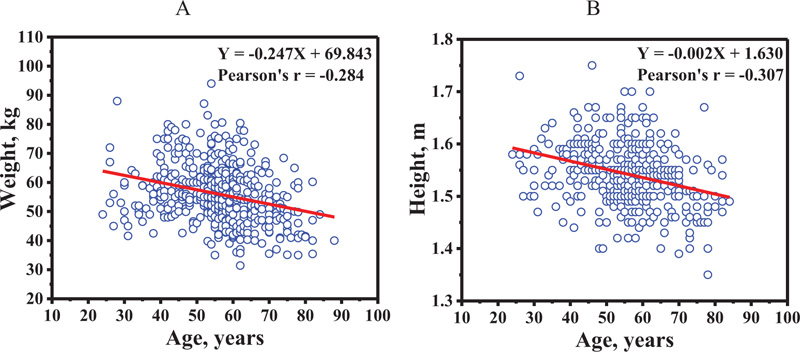
The relation between BMD at distal forearm and weight, and height is shown in Figs. (3A and 3B), respectively. The BMD increased as a function of weight (Pearson's r = 0.389), and height (Pearson's r = 0.267). Age plotted against weight and height is shown in Figs. (4A and 4B), respectively. The weight (Pearson's r = -0.284) and height (Pearson's r = -0.307) decreased as a function of age. This data suggests that the influence of age on BMD at distal forearm might be affected by weight and height.
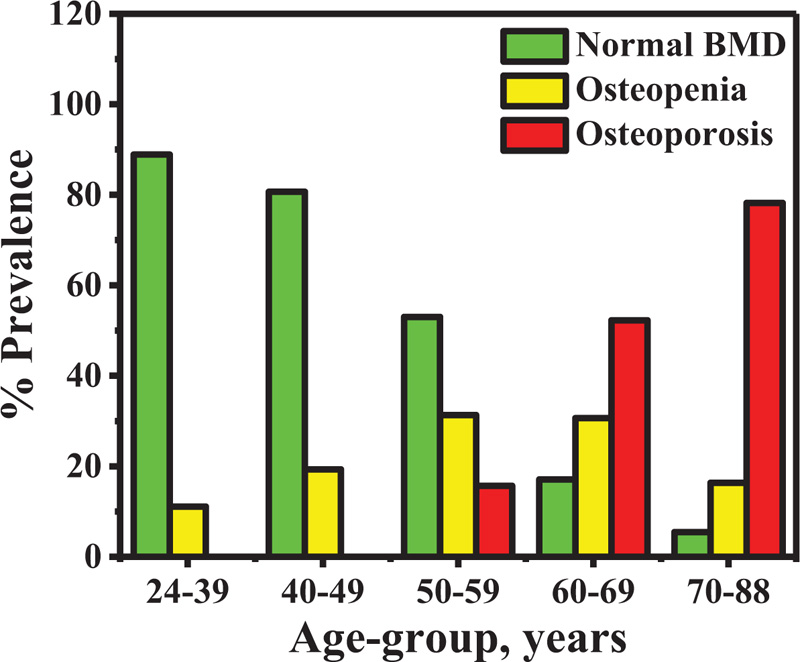
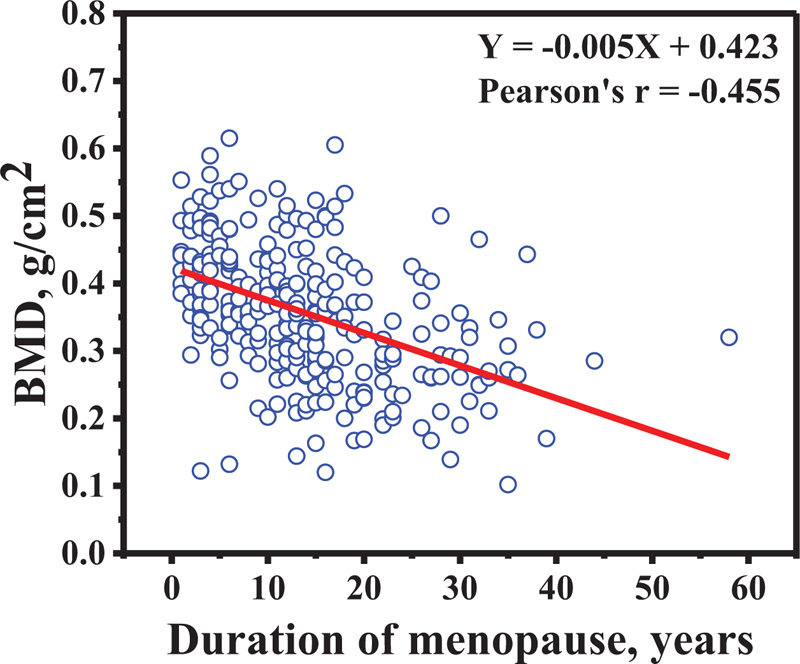
The percentage prevalence of osteopenia and osteoporosis in all subjects is shown in Fig. (5). The percentage of prevalence increased as a function of age-group in osteoporosis group, while it decreased in normal bone density. In addition, the BMD at distal forearm decreased when the duration of menopause increased (Pearson's r = -0.455) as indicated in Fig. (6).
4. DISCUSSION
The authors measured the cortical bone density at distal and proximal radius by using peripheral quantitative computed tomography (pQCT). The authors found that the cortical bone density decreased with age because bone cortex density slowly decreases from the inner part to the outer part. The trabecular bone density also decreases with aging. However, the overall mass did not change due to an age-related enlargement in the trabecular area. The findings suggests that fracture risk of the distal radius might be related to decrease in cortical bone and enlargement in trabecular area occurring with age [25].
The radius at the distal third is a stable area and is able to be reproduced for measuring the BMD using DEXA. Itoh S. et al. [26] studied bone mineral density in the distal radius of healthy Japanese adults. The authors also compared bone mineral density in the non-fracture and fracture groups. The authors found that changes in bone mineral density in the distal radius occur with age in both healthy women and men adults. Bone mineral density began to decrease in the sixth decade and the seventh decade for women and men, respectively. Similarly, Sriburee S. et al. [27] measured bone mineral density in the distal radius of hill tribes in the Omkoi District, Chiang Mai Province, Thailand. The authors found that the bone mineral density decreased in distal radius by negative correlation with age in both women and men adults. Previously, we had reported the prevalence of BMD, osteopenia and osteoporosis in the distal forearm of Thai men over 40 years of age in Mae Chaem District, Chiang Mai Province, Thailand. We found that the highest and lowest BMD occurred in the age-group 40–49 years and age-group 70–87 years, respectively. Moreover, the data showed that the percentage of osteopenia and osteoporosis increased, while decreases took place in normal bone density when age had increased [28]. In ways consistent with previous studies, the prevalence of osteoporosis in women who resided in Mae Chaem District, Chiang Mai Province, Thailand was determined in this current study. The highest and lowest BMD was found in the age-group 24-39 years and in the age-group 70-88 years, respectively. The BMD decreased in osteopenia and osteoporosis persons, while increases occurred in that of normal bone density. The results from previous studies [28] and this current study suggests that there is a prevalence of osteoporosis in both men and women taking place in Mae Chaem District, Chiang Mai Province, Thailand. This finding also suggests that this population need to be under health surveillance due to the risk of fracture at the distal radius.
There was a study done on Puerto Rican women (n= 57, age 50–69 years) showing that osteoporosis at the lumbar spine and femoral neck was 12% and 8.7%, respectively, for women who lived on the island of Puerto Rico [29]. Similarly, the overall prevalence of osteoporosis and low bone mass was 10.5% and 43.3%, respectively for 953 Puerto Rican adults, aged 47 to 79 years who had been living on the US mainland [30].
Other studies reporting the prevalence of osteoporosis in women have been shown. A study on Indian women above 50 years of age reported a prevalence of 42.5% at either the lumbar, spine, femoral neck, or forearm sites [8], while another study done on Chinese women by Lu YC. et al. [31] and Korean women by Lee KS. et al. [32] reported a prevalence of 18.4% and 24.4%, respectively. In addition, Saei Ghare Naz M. et al. [33] reported that the total prevalence of osteoporosis in Iranian women study was 42.2%.
Although osteoporosis is found in both men and women, it is more common in men, yet it is less severe than in women, and there is a markedly increasing prevalence in post-menopause. Osteoporosis occurs in about 30% of all post-menopausal women in the U.S.A. and Europe. These women will likely have osteoporotic fractures sometime in their remaining lifespans [34, 35]. In addition, Ejaz S. et al. [36] showed an osteoporosis prevalence of 49.3% in Pakistani postmenopausal women, whereas another study by Kadam N. et al. [37] reported an osteoporosis prevalence of 25.8% in postmenopausal Indian women. Tarig S. et al. [38] carried out the BMD findings on 168 postmenopausal women at the distal metaphysis of the proximal phalanges of fingers II to V using an ultrasound bone densitometer. The authors found that the increasing of age and waist to hip ratio caused reduction of BMD in postmenopausal women. The current studies were consistent with the research that was conducted by Tariq S. et al. [38]. The current study found osteoporosis at the distal forearm in postmenopausal women. Although there was consistency in these results, the experimental designs were different between the current study and the study that was conducted by Tariq S. et al. [38] including the sites studied and bone densitometer systems that were used. Moreover, the BMD at distal forearm decreased as a function of the duration of menopause increasing. Kadam N. et al. [39] showed osteoporosis prevalence of 18.4% and 37% in postmenopausal women who were less than 5 and more than 5 years since menopause, respectively. The authors also suggested that menopause in women caused a rapid decreasing in BMD.
Notably, there is strength in this current study in that our subjects were highly characteristic of the population of Mae Chaem District because our subjects resided in 7 out of 8 of the sub-districts (tambons) of Mae Chaem District. Although our subjects were distributed in almost all of that area, the number of subjects in each of the sub-districts was rather small. In addition, some recall bias data were obtained in this study because of some questions on the questionnaires inquired about past history. Regardless, we successfully determined the prevalence of osteopenia and osteoporosis in women who resided in Mae Chaem District, Chiang Mai Province, Thailand.
CONCLUSION
The prevalence of osteoporosis was found in women living in Mae Chaem District, Chiang Mai Province, Thailand. The present study provides information to guide strategies for preventing osteoporosis and improving the quality of life of the Thai population in countryside areas.
LIST OF ABBREVIATIONS
| BMD | = Bone Mineral Density |
| WHO | = World Health Organization |
| SD | = Standard Deviation |
ETHICS APPROVAL AND CONSENT TO PARTICIPATE
All procedures were approved by the Ethics Committee of the Faculty of Associated Medical Sciences, Chiang Mai University, Chiang Mai, Thailand.
HUMAN AND ANIMAL RIGHTS
No animals were used in this research. All research procedures followed were in accordance with the ethical standards of the committee responsible for human experimentation (institutional and national), and with the Helsinki Declaration of 1975, as revised in 2008 (http://www.wma.net/en/20activities/10ethics/10helsinki/).
CONSENT FOR PUBLICATION
Written informed consent was obtained from all the participants before being performed.
STANDARDS OF REPORTING
STROBE guidelines were followed.
AVAILABILITY OF DATA AND MATERIALS
The data supporting the findings of the article is available within the article.
FUNDING
This work was partially supported by Chiang Mai University.
CONFLICT OF INTEREST
Dr. Suchart Kothan is the Editorial Board Member of The Open Public Health Journal.
ACKNOWLEDGEMENTS
We are thankful to the local government of Mae Chaem District, Chiang Mai Province, Thailand for supporting and facilitating this research. We would also like to thank the students who participated in this study.

