All published articles of this journal are available on ScienceDirect.

Semi-parametric Model to Study the Risk Factors of Tuberculosis among Adult men in South Africa
Authors Info & Affiliations
Abstract
Background:
Understanding the relationship between tuberculosis and the risk factors of tuberculosis is vital to be able to address them. Even though tuberculosis is curable and preventable, it remains a public threat, especially in low- and middle-income countries. There are more cases of men infected with tuberculosis compared to women.
Methods:
This study determines the risk factors that influence TB infection among adult men in South Africa. The Generalized Additive Mixed Models that incorporate a nonparametric smooth additive function were used to analyze the 2016 South African Demographic Health Survey. The Generalized Additive Model and Generalized Additive Mixed Model were compared to find the most suitable model.
Results:
The finding reveals that the significant determinates associated with tuberculosis were: region, primary education compared to secondary, race, health, weight, and wealth index, which were modeled parametrically. The conclusion is that only the interaction effect of age and number of times away from home were significant in variables modeled non-parametrically.
Conclusion:
In conclusion, the South African government needs to intervene on men living in Western Cape, Eastern Cape, Northern Cape, Free State, and men with poor health - to reduce South Africa’s infections. The government should also implement programs that will teach and discourage lower body mass index. Thus, targeting the factors that have a positive significant effect among adult men can help to reduce the risk of having tuberculosis.
1. INTRODUCTION
Tuberculosis remains a public health threat in all countries. Tuberculosis is an infection that typically affects the lungs. Nevertheless, it can also affect other organs like the brain and spine [1]. Tuberculosis is caused by an airborne bacterium named Mycobacterium. Mycobacterium is one of the top ten causes of death among infectious agents and is also one of the oldest recognized infections. Tuberculosis (TB) cannot be transmitted from surfaces where a TB patient has been and touched such as for COVID-19. However, Mycobacterium is mainly transmitted when infected people exhale, thereby discharging small particles of e bacteria into the air, and nearby people breathe these bacteria and are consequently infected.
Getting infected by the TB bacteria does not necessarily result in sickness. There are two types of tuberculosis: Latent and Active TB. Latent infection occurs when a person’s immune system prevents the bacteria from spreading. Active infection occurs when the bacteria multiply and infect the organs. Although TB can strike anyone, the literature suggests that most people who develop the disease are adults. TB is more common among men than women [2].
In this study, we examine the factors that affect TB among adult men and how these factors impact them, which we believe can help in addressing those factors. As a result, there could be a reduction in the number of TB cases and deaths. Ten million people contract tuberculosis each year, according to the World Health Organization (WHO) [3]. Despite being curable and preventable, TB still kills 1.5 million people each year, making it the leading infectious killer in the world. About two-thirds of new TB cases in 2019 are present in low-and middle-income countries [2].
A report on mortality and mortality causes in South Africa was released by Statistics South Africa (StatsSA) [4]. This report suggests that in 2010, there were 6,3% fewer deaths than in 2009. Data shows that more men than women die of tuberculosis, and 30-39-year-olds are at the highest risk. South Africa had the highest death rate from TB; about 12% of deaths in 2010 were caused by TB [4]. According to the data, there were more sick Black Africans than other race groups.
2. METHODS AND MATERIALS
2.1. Data Source
For this study, the 2016 South African Demographic Health Survey was used. The survey was carried out by Statistics South Africa and the South African Medical Research Council. The survey was conducted in 15292 households. In the sample of households, 8514 women, aged 15-49, completed interviews with individuals. 10336 men aged 15 and older completed interviews on adult health. The variable of interest is a binary variable indicating whether a health worker told a person about the status of having tuberculosis.
2.2. Statistical Methods
The relationship between the response and the predictors may not always be linear. When there is no such linearity, we need additive models. The Generalized Additive Models (GAM) follow additive models as the extension of the Generalized Linear Model (GLM) that incorporates an additive term in the linear predictor, and the response may belong to any exponential family distribution [5]. Suppose yi is the response variable whose distribution belongs to the exponential family, then the generalized additive model is defined by:
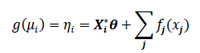 |
gμ is a one-to-one function, X*i is the ith row matrix of the model, θ is the parametric estimates vector. ƒj(.) are the smooth functions. Smooth functions allow the flexible specification of the dependence of the response on the covariates, then a parametric relationship. P-spline estimates the inference of GAM.
The province's effect on the likelihood of developing tuberculosis is fixed for the Generalized Additive Mixed Model (GAMM). On the other hand, neighboring provinces may have a similar effect compared to non-neighboring due to spatial autocorrelation. We will study an extension of the Generalized Linear Mixed Model, which is the Generalized Additive Mixed Model, a model in which parametric fixed effects can be modeled non-parametrically by incorporating a smooth additive function as a random effect [6-10]. The GAMM explores the nonlinear relationship between the dependent variable and covariates. The GAMM has the following structure:
 |
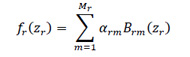
Where the β vector of the fixed effect of the predictors, ƒr(.) is a smooth arbitrary function of the predictors and ƒspat(si) is the non-linear spatial effect. Using penalized splines (P-splines) with B-spline basis functions, smooth functions ƒr are estimated [11]. A spline is defined as a linear combination of Mr = nr + v B-spline basis function Brm, and the regression coefficient of αrm as
 |
Approximating the smooth function involves choosing the number of knots (where the knots are zr{min}< ξro <…. ξrnr < zr{max} equally spaced). The choice of the number of knots is that too many knots can lead to curves that overfit the data, resulting in too rough functions. However, too few results do not always capture the variability in the data; between 20-40 equally spaced knots ensures flexibility [12]. Thus, the penalized likelihood estimation is given as:
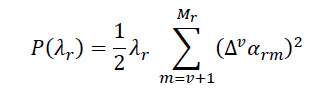 |
where λr is the smooth parameter and ∆v is the differencing operator.
3. RESULTS AND DISCUSSION
Table 1 indicates that regions Western Cape, Eastern Cape, Northern Cape, Free State, KwaZulu-Natal, and Mpumalanga were positively significant with the risk of having tuberculosis when all these regions were compared to Limpopo. The odds ratios were 6.098, 3.808, 3.979, 3.881, 2.729, and 2.376, respectively. This implies that men from all provinces mentioned above are more likely to have TB than men from Limpopo [13].
| Parameter | Estimate | S.E | OR | P-Value |
|---|---|---|---|---|
| Intercept | -3.502 | 0.363 | 0.030 | <2e-16*** |
| Chronic disease (ref = NO) | - | - | - | - |
| Yes | 0.129 | 0.168 | 1.138 | 0.443 |
| Region (ref = Limpopo) | - | - | - | - |
| Western Cape | 1.808 | 0.385 | 6.098 | 2.70e-06*** |
| Eastern Cape | 1.337 | 0.289 | 3.808 | 3.78e-06*** |
| Northern Cape | 1.381 | 0.335 | 3.979 | 3.87e-05*** |
| Free State | 1.356 | 0.325 | 3.881 | 3.05e-05*** |
| KwaZulu-Natal | 1.004 | 0.307 | 2.729 | 0.001** |
| North West | 0.279 | 0.337 | 1.322 | 0.407 |
| Gauteng | -0.602 | 0.466 | 0.548 | 0.196 |
| Mpumalanga | 0.865 | 0.310 | 2.376 | 0.005** |
| Education Level (ref = Secondary) | - | - | - | - |
| No education | 0.122 | 0.254 | 1.130 | 0.631 |
| Primary | 0.442 | 0.168 | 1.556 | 0.009** |
| Higher | 0.437 | 0.283 | 1.548 | 0.122 |
| Ethnicity (ref = Black/African) | - | - | - | - |
| White | -2.023 | 0.757 | 0.132 | 0.008** |
| Colored | -0.725 | 0.283 | 0.485 | 0.011* |
| Indian/Asian | -997.9 | 4840 | 0.000 | 0.984 |
| Other | -997.8 | 7823 | 0.000 | 0.990 |
| Wealth Index (ref = Middle) | - | - | - | - |
| Poorest | 0.042 | 0.198 | 1.042 | 0.833 |
| Poor | -0.051 | 0.195 | 0.950 | 0.987 |
| Richer | -0.551 | 0.225 | 0.577 | 0.014* |
| Richest | -0.252 | 0.272 | 0.777 | 0.354 |
| Marital status (ref = Never in a union) | - | - | - | - |
| Married | -0.242 | 0.197 | 0.785 | 0.220 |
| Living with partner | -0.326 | 0.230 | 0.722 | 0.887 |
| Widowed | 0.729 | 0.324 | 2.073 | 0.024* |
| Divorced | 0.973 | 0.425 | 2.645 | 0.022* |
| Separated | 0.313 | 0.347 | 1.367 | 0.367 |
| Health (ref = Good) | - | - | - | - |
| Poor | 0.752 | 0.217 | 2.121 | 0.001*** |
| Average | 0.208 | 0.168 | 1.232 | 0.214 |
| Excellent | -0.169 | 0.257 | 0.844 | 0.509 |
| Weight (ref =Normal) | - | - | - | - |
| Underweight | -0.632 | 0.186 | 0.532 | 0.051 |
| Overweight | -0.878 | 0.377 | 0.416 | 0.02* |
| Obese | 1.216 | 0.847 | 3.374 | 0.151 |
| Don't know | -0.321 | 0.660 | 0.723 | 0.623 |
| Smoking Status (ref = Everyday) | - | - | - | - |
| Do not smoke | -0.0002 | 0.148 | 1.000 | 0.999 |
| Sometimes | -0.130 | 0.294 | 0.878 | 0.658 |
Men with primary education (OR =1.556) are more likely to have tuberculosis than men with secondary education. Whites and Coloreds have a negative association with the risk of having tuberculosis compared to Black men. The corresponding odds ratios are 0.132 and 0.485, respectively. This implies that Whites are (1-0.132) %= 86.8%% less likely to have tuberculosis than Blacks, and Coloreds are (1-0.485) %= 51.5% less likely to have tuberculosis than Black men [14].
Furthermore, richer men from South Africa have a negatively significant effect on the risk of having TB compared to men with a middle wealth index. The corresponding odds ratio is .577. This implies that richer men are (1-0.577) % =42.3% times less likely to be at risk of having tuberculosis than the middle wealth index. The parametric effect for divorced and widowed men is a positively significant effect on the risk of having TB compared to those who were never in union, with an odds ratios of 2.645 and 2.073, respectively. This implies divorced men are 2.645 times more likely to have TB than men who were never in a union, and widowed men are 2.073 times more likely to be at risk of having tuberculosis than men who were never in a union. Men with poor health have a positively significant effect of tuberculosis compared to men with good health. The corresponding odds ratio is 2.121. This implies that the odds of having tuberculosis for men with poor health status are 2.121 times more likely than for men with good health. Overweight is a negatively significant effect on the risk of having TB compared to underweight with OR =0.416. This implies that overweight men are (1-0.416) %=58.4% less likely to have TB than underweight men.
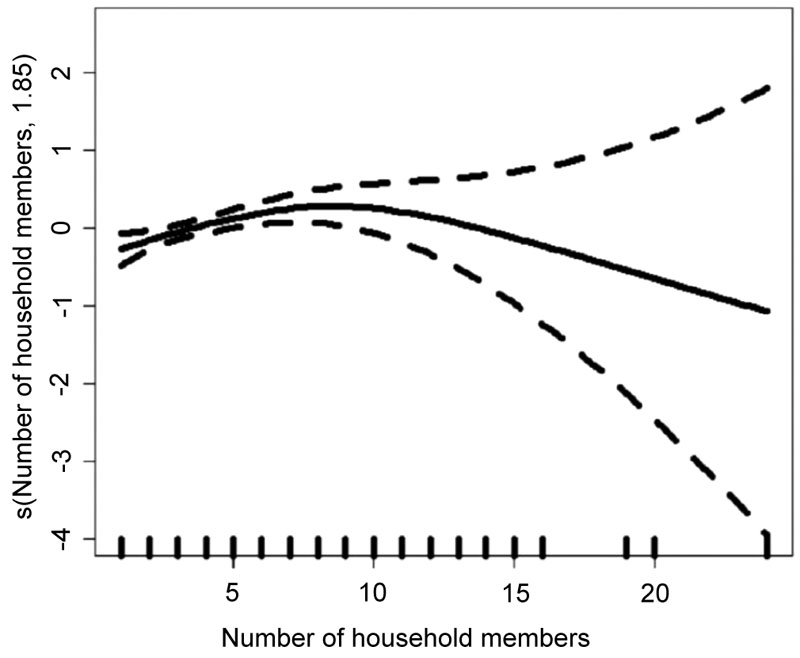
Table 2 indicates the approximate significance of smooth terms for the fitted GAMM. The value of the statistic test is 4.356 with 2.009 degrees of freedom (p-value=0.014) against the assumption that the number of household members is linearly associated with the risk of TB. The statistic test is 1.179 with 6.073 degrees of freedom with high significance (p-value=1.34e-08) against the assumption that the interaction effect of age and the number of times away from home is linearly associated with the risk of tuberculosis. Fig. (1) shows the smooth term and confidence interval. The number of household members has some quadratic effect; the risk of having tuberculosis increases with eight household members.
The findings from Table 3 show some similarity in the results in terms of the p-value. All significant variables in GAM are also significant in GAMM. The standard error of White increased by 0.26%. The standard error for widowed and divorced was increased by 0.19% and 0.02%. Western Cape, Eastern Cape, Free State, Northern Cape, KwaZulu-Natal, and Mpumalanga regions standard errors were increased by 0.44%, 0.24%, 0.31%, 0.27%, 0.33% and 0.32% respectively. The standard errors of significant parameters in the GAMM are higher than those of the significant parameters in the GAM. This suggests that the GAM may lead to false precisions and estimates. Thus, GAMM with smooth terms as the random effect is better than GAM.
| Smooth Terms | Edf | F-value | P-value |
|---|---|---|---|
| S(Number of household member) | 2.009 | 4.356 | 0.014* |
| s(Surrent age) | 1.141 | 0.367 | 0.486 |
| s(Number of times away from home) | 1.000 | 0.253 | 0.615 |
| s(Age, number of times away from home) | 6.073 | 1.179 | 1.34e-08*** |
| - | GAM | GAMM | ||||
|---|---|---|---|---|---|---|
| Indicator | Estimate | S.E | P-Value | Estimate | S.E | P-Value |
| Intercept | -3.490 | 0.362 | <2e-16*** | -3.502 | 0.363 | <2e-16*** |
| Chronic disease (ref = NO) | - | - | - | - | - | - |
| Yes | 0.134 | 0.168 | 0.426 | 0.129 | 0.168 | 0.443 |
| Region (ref = Limpopo) | - | - | - | - | - | - |
| Western Cape | 1.824 | 0.383 | 2.02e-06*** | 1.808 | 0.385 | 2.70e-06*** |
| Eastern Cape | 1.337 | 0.288 | 3.47e-06*** | 1.337 | 0.289 | 3.78e-06*** |
| Northern Cape | 1.367 | 0.334 | 4.33e-05*** | 1.381 | 0.335 | 3.87e-05*** |
| Free State | 1.348 | 0.324 | 3.16e-05*** | 1.356 | 0.325 | 3.05e-05*** |
| KwaZulu-Natal | 1.013 | 0.306 | 0.005228** | 1.004 | 0.307 | 0.001094** |
| North West | 0.272 | 0.336 | 0.412 | 0.279 | 0.337 | 0.407 |
| Gauteng | -0.599 | 0.464 | 0.196 | -0.602 | 0.466 | 0.196 |
| Mpumalanga | 0.862 | 0.309 | 0.005228** | 0.865 | 0.310 | 0.005241** |
| Education Level (ref = Secondary) | - | - | - | - | - | - |
| No education | 0.100 | 0.253 | 0.693 | 0.122 | 0.254 | 0.631 |
| Primary | 0.432 | 0.168 | 0.009952** | 0.442 | 0.168 | 0.008598** |
| Higher | 0.462 | 0.282 | 0.101 | 0.437 | 0.283 | 0.122 |
| Ethnicity (ref = Black/African) | - | - | - | - | - | - |
| White | -2.063 | 0.755 | 0.006279** | -2.023 | 0.757 | 0.007555** |
| Colored | -0.752 | 0.283 | 0.007887** | -0.725 | 0.283 | 0.010495* |
| Indian/Asian | -41.890 | 8523000.000 | 1.000 | -997.900 | 4840.000 | 0.984 |
| Other | -41.740 | 47454000.000 | 1.000 | -997.800 | 7823.000 | 0.990 |
| Wealth Index (ref = Middle) | - | - | - | - | - | - |
| Poorest | 0.057 | 0.198 | 0.773 | 0.042 | 0.198 | 0.833 |
| Poor | -0.023 | 0.195 | 0.908 | -0.051 | 0.195 | 0.987 |
| Richer | -0.562 | 0.224 | 0.012174* | -0.551 | 0.225 | 0.014212* |
| Richest | -0.276 | 0.272 | 0.310 | -0.252 | 0.272 | 0.354 |
| Marital status (ref = Never in union) | - | - | - | - | - | - |
| Married | -0.270 | 0.200 | 0.178 | -0.242 | 0.197 | 0.220 |
| Living with partner | -0.063 | 0.234 | 0.789 | -0.326 | 0.230 | 0.887 |
| Widowed | 0.731 | 0.323 | 0.023568* | 0.729 | 0.324 | 0.024309* |
| Divorced | 0.977 | 0.425 | 0.021440* | 0.973 | 0.425 | 0.022076* |
| Separated | 0.311 | 0.347 | 0.370 | 0.313 | 0.347 | 0.367 |
| Health (ref = Good) | - | - | - | - | - | - |
| Poor | 0.739 | 0.216 | 0.000618*** | 0.752 | 0.217 | 0.000521*** |
| Average | 0.214 | 0.169 | 0.201 | 0.208 | 0.168 | 0.214 |
| Excellent | -0.182 | 0.256 | 0.476 | -0.170 | 0.257 | 0.509 |
| Weight (ref =Normal) | - | - | - | - | - | - |
| Underweight | -0.358 | 0.185 | 0.054 | -0.632 | 0.186 | 0.051 |
| Overweight | -0.879 | 0.377 | 0.019644* | -0.878 | 0.377 | 0.020012* |
| Obese | 1.288 | 0.840 | 0.125 | 1.216 | 0.847 | 0.151 |
| Don't know | -0.346 | 0.659 | 0.600 | -0.324 | 0.660 | 0.623 |
| Smoking Status (ref = Everyday) | - | - | - | - | - | - |
| Do not smoke | -0.001 | 1472.000 | 0.936 | 0.000 | 0.148 | 0.999 |
| Sometimes | -0.164 | 0.293 | 0.578 | -0.130 | 0.294 | 0.657 |
CONCLUSION
The main purpose of this study was to examine tuberculosis risk factors using the 2016 South African Demographic Health Survey. The Generalized Additive Mixed Model was used to identify risk factors associated with tuberculosis. The response variable is the binary status of tuberculosis in men. The effect of age, number of household members, number of times away from home, and interaction effect of age and number of times away from home were analyzed non-parametrically while other covariates were modeled parametrically.
From the result, we can see that the only variables that are significant from both models are: region, race, marital status, weight, education and wealth index. We observe that the risk of having tuberculosis decreases for overweight men, as the higher body mass index (such as for overweight) negatively affects the risk of having tuberculosis compared to underweight. This result is supported by Buskin et al. (1994) and Shetty et al. (2006).
The Western Cape, Eastern Cape, Northern Cape, Free State, KwaZulu-Natal, and Mpumalanga regions as compared to Limpopo, are highly affected by tuberculosis.
Education plays an important role as it is a significant effect on the risk of having tuberculosis. Men with primary education are most likely to be affected by tuberculosis when compared to men who have secondary education.
Whites and men of color have lower chances of having tuberculosis than Africans. Indians and other races have no significant effect of tuberculosis when compared to Blacks. Wealth index also affects the risk of having tuberculosis in South Africa. Richer men have a lower risk of having tuberculosis than men in the middle class. Furthermore, marital status affects the risk of having tuberculosis. Divorced men and widowed men are highly affected by tuberculosis when compared to men who have never been in a union.
In conclusion, the South African government needs to inspect men living in Western Cape, Eastern Cape, Northern Cape, Free State, and men with poor health - to reduce South Africa’s infections. The government should also implement programs that will teach and discourage lower body mass index. Thus, targeting the factors that have a significant positive effect among adult men can help reduce the risk of having tuberculosis.
LIST OF ABBREVIATIONS
| GAM | = Generalized Additive Models |
| GLM | = Generalized Linear Model |
| GAMM | = Generalized Additive Mixed Model |
ETHICS APPROVAL AND CONSENT TO PARTICIPATE
Not applicable.
HUMAN AND ANIMAL RIGHTS
Not applicable.
CONSENT FOR PUBLICATION
Not applicable.
AVAILABILITY OF DATA AND MATERIALS
The data supporting the findings of the article is available in the Demographic and Health Surveys at https://dh sprogram.com/data/dataset_admin/login_main.cfm?CFID=35921003&CFTOKEN=eab0dc5e4d1182a9-994A35C3-A2C1-7748-F3B33EF5D3DBA210
FUNDING
None.
CONFLICT OF INTEREST
The authors declare no conflict of interest, financial or otherwise.
ACKNOWLEDGEMENTS
Declared none.

