All published articles of this journal are available on ScienceDirect.

Utilization of Health Resources During the Coronavirus Pandemic in Israel: Meuhedet Health Services’ Real Data Analysis and Future Conclusions
Authors Info & Affiliations
Abstract
Aim:
This study aimed to examine the utilization of health resources during the first year of the COVID-19 pandemic in Israel through the analysis of Meuhedet Health Services’ real-world database.
Background:
The history of COVID-19 in Israel comprises three waves: from February to May 2020, from May to November 2020, and from November 2020 to April 2021. Restrictions imposed on the Israeli population included travel limitations and even lockdowns. Meuhedet Health Services, the third largest health management organization in Israel, manages all its medical data through computerized electronic files and has collected various types of health services data from 2018 to 2020. This paper compared the consumption of Meuhedet Health Services over two consecutive years of the pandemic using a real-world database.
Methods:
Electronic medical records from primary care physicians, laboratory tests, hospitalization medical histories, treatments in hospitals and institutes, visits to and treatments by community physicians, and prescriptions and medical equipment consumption were collected from 2018 to 2020. This research used aggregated, non-personalized, and decoded data from a cohort of insured individuals, and the research was approved by all the relevant institutional Helsinki Committees. The data analysis compared the corresponding data in a chosen month of the year with the data in the same month of the previous year. The differences were then scaled by the data corresponding to the month of the previous year, and the result was multiplied by 100 and plotted.
To analyze drug consumption, we used the fixed price of every drug in a year multiplied by the difference in consumption of the drug in question between the month of the current year and the same month of the previous year, multiplied by 100.
Results:
A significant decrease was noted in hospitalization days, general hospital outpatient clinic visits, general hospital emergency room visits, and total numbers of visits to community physicians during the first lockdown in the first wave of the pandemic in comparison to 2019. At the end of the lockdown, however, a compensatory increase was noted in all services. In terms of drug consumption, the data showed no differences in the effects of the different waves. Our findings revealed that the first wave of COVID-19 was a shock, with a significant reduction in the consumption of health services, but this decrease attenuated with the second wave due to immediate management interventions and safety rules implemented in hospitals and clinics.
Conclusion:
People shun medical services during a fast-spreading epidemic that causes significant mortality. Since new variants of COVID-19 could be part of our lives for the next few years, we should learn how to continue living with the pandemic and develop alternative medical services to maintain healthy states. Digitization, remote services, telemedicine, and home care, including home hospitalization, should be part of the health services to cope with pandemic situations.
1. INTRODUCTION
Since the National Health Law was established in 1994, Israel has had a national health insurance system that provides health insurance to all its citizens. Every Israeli citizen is entitled to receive health care services provided by a health maintenance organization (HMO). In Israel, there are four competing nonprofit HMOs [1]. The two largest organizations provide health services to almost 80% of Israel’s population. All citizens are free to choose their HMO, regardless of age or medical condition, and to transfer from one organization to another. Furthermore, all insured citizens are entitled to every medical service in the national health basket through their HMO, of reasonable quality and at a reasonable time and distance. The governmental budget is the main financial source for HMOs, although services available through private financing are increasing yearly [2].
Health care in Israel is similar to that in other Organisation for Economic Co-operation and Development (OECD) countries. The life expectancy of both Israeli men and women is among the top third of OECD countries [3], despite the share of the country’s gross domestic product assigned to health being comparably lower than the OECD average, 7.6% versus 8.9% [4, 5]. Israel’s society is young compared to other developed countries, with only 11% of the population older than 64 years, a percentage expected to reach 14% by 2030.
Israel’s hospitalization system consists mostly of governmental hospitals [6], which hold about 47% of all general beds, and the hospitals of the largest HMO, Clalit, hold about 30% of all general beds. Overall, the bed occupancy rate in hospitals is over 90%, and Israel’s average of three hospital beds per 1,000 people is among the highest of the OECD countries, with an average of 3.8 hospital beds per 1,000 people, according to 2000 data [7].
Israel’s healthcare systems frequently change and implement reforms to reduce health disparities and improve services provided both at home and in hospitals. An example is the extensive monitoring program of the quality of care in the community system [8], which includes over 50 quality indicators, all related to significantly improving healthcare outcomes. A similar program of quality indicators is also initiated for hospitals as well.
1.1. History of the COVID-19 Pandemic in Israel
This study focuses on examining the changes in medical service consumption, including hospitalizations, community services, and drug consumption, during three waves of the COVID-19 epidemic in Israel between 2020 and 2021, compared to the prior years of 2019 and 2018. The waves are from February to May 2020, from May to November 2020, and from November 2020 to April 2021.
1.1.1. First Wave: February to May 2020
On February 21st, Israel confirmed the first case of COVID-19, and on March 19th, the Israeli government declared a national state of emergency. Israelis were prohibited from leaving their homes unless necessary, and only essential services were to remain open.
On March 25th, the government imposed even stricter restrictions, barring people from going more than 1,000 m (330 ft) from their homes, except, for example, to go to work, according to regulations, to obtain food, medicine, and essential products and services, and to receive medical treatment. Violations were subject to a 5,000 shekel fine or up to six months imprisonment.
Starting the evening of Wednesday, April 8th, 2020, on the eve of Passover, the government declared a more extensive lockdown during that holiday week, from Tuesday evening until Saturday evening. Only on April 19th, there was an initial easing of lockdown restrictions.
1.1.2. Second Wave: May to November 2020
From May to November 2020, the government’s response relaxed slightly, permitting social gatherings of no more than 20 people, limiting the number of synagogue worshippers to 19, the number of people on public buses to 20, and the number of restaurant guests to 20 indoors and 30 with outdoor seating, but still maintaining the closure of gyms, night clubs, cultural venues, and event halls.
1.1.3. Third Wave: November 2020 to April 2021
The third wave of COVID-19 was from November 2020 to April 2021, and on December 24th, 2020, the government declared the third nationwide lockdown to begin on December 27th, 2020. Restrictions included travel limited to a 1,000-meter radius from home (with individual sports activities allowed), gatherings for approved events (e.g., funerals and weddings) limited to 10 people indoors or 20 people outdoors, and no visits to other people’s homes. With the closure of all non-essential stores and services, businesses that did not receive customer visits could remain open at 50% capacity or accommodate up to 10 employees, whichever was greater. Restaurants were to be open for delivery service only. Bed and breakfasts, zoos, safaris, parks, alternative medicine centers, and beauty and hair salons were all closed, and public transportation was reduced to 50% capacity.
2. METHODS
2.1. Sources of Information and Data Collection
Meuhedet Health Services is the third largest HMO in Israel, covering about 1.28 million insured citizens, and it manages all its medical data through computerized electronic files. These data include demographic information, electronic medical records from primary care physicians, laboratory tests, medical history of hospitalizations, various treatments in hospitals and institutes, visits to and treatments by community physicians, prescriptions and medical equipment consumption, and medical quality indicators.
This research used aggregated, non-personalized, and decoded data from a cohort of insured persons from the Meuhedet Health Fund database. The research was approved by all the relevant institutional Helsinki Committees. This type of analysis falls under the category of real-world evidence, where patients’ records are analyzed over time to obtain aggregated results. We executed a data-mining query plan on Meuhedet’s insured population of 1.28 million (i.e., a sample size of 1.28 million insured patients).
This study collected various types of data from different sources, as follows:
Data from public hospitals (usually governmental hospitals) cover
- Hospitalization days
- Outpatient clinic visits
- Emergency room (ER) visits
Data on community services cover
- Visits to community physicians. These data are based on regularly updated information from the medical electronic records on all insured visits to any physician.
- Drug consumption. These data are based on the actual dispensing of medicines by pharmacies. They reflect relative changes in drug consumption over periods rather than absolute monetary expenditures to avoid changes in the cost of medications throughout the years.
2.2. Data Analysis
The data analysis of non–COVID-19 hospitalization days, outpatient clinic visits, and ER visits, respectively, compared the corresponding data in a chosen month of the year with the data in the same month of the previous year. The differences were then scaled by the data corresponding to the month of the previous year, and the result was multiplied by 100 and plotted. For example, the number of ER visits between November, 2020, and November, 2019, is divided by the number of ER visits in November, 2019, and then multiplied by 100.
To analyze drug consumption, we used the fixed price of every drug in the year 2020 multiplied by the difference in consumption of the drug in question between the month of the current year and the same month of the previous year, multiplied by 100. This method compensates for yearly changes in drug prices and enables us to consider actual changes in drug consumption for every month between consecutive years. Consumption is defined by the number of packages of every drug dispensed by all pharmacies.
3. RESULTS
Although the number of average daily active cases in the first wave was low compared to the third wave, according to the Israeli Ministry of Health database (182 on April 29th, 2020, versus 6,284 on September 28th, 2020), the public understood immediately at the beginning of the pandemic that we were dealing with an unknown disease and reacted immediately in terms of health resource utilization, as described in the next subsections.
3.1. Hospital Services
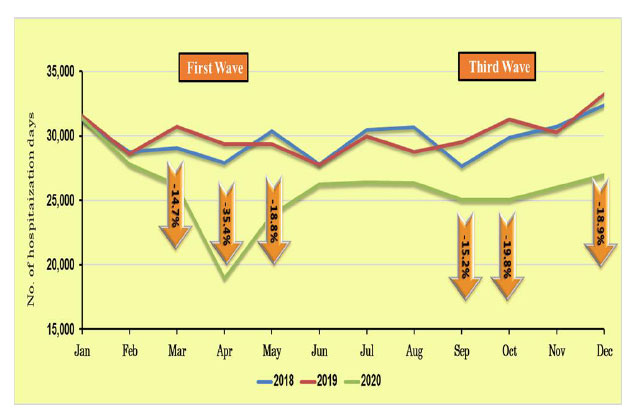
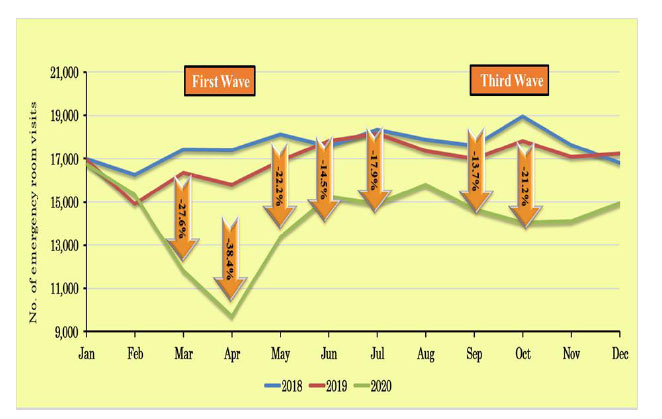
Figs. (1-3) show the trends in the Israeli hospitalization system in 2018 and 2019 in terms of numbers of non–COVID-19 hospitalization days, ER visits, and outpatient clinic visits, respectively, compared to the COVID-19 waves from January to October, 2020.
The use of hospital services throughout the Israeli hospitalization system followed similar trends in 2018 and 2019. However, during the first COVID-19 wave, the first lockdown in April clearly affected the use of hospital services by the Israeli population, with a radical decrease observed in hospitalizations (Fig. 1), as well as ER and clinic visits (Figs. 2 and 3). After the first lockdown, there was an increase in general hospital visits (in May 2020), but the levels did not reach those of previous years. The same trends were also noted for Sheba Medical Center, Israel’s largest general public hospital [9].
Again, reflecting Israel’s general hospital system (Fig. 2), total visits to the ER at the Sheba Medical Center from March to October, 2020, decreased by 18.5% compared to previous years. The main effects and most dramatic decreases in ER visits and numbers of hospitalizations were observed during the first lockdown in April, 2020, when the number of patients admitted to Sheba’s medical wards decreased by 28%.
Medical services at Israeli hospitals and community clinics continued to be available during the entire lockdown period, but the media presented terrifying pictures of COVID-19 wards and hospital staff exhausted by the burden of the disease and high hospital mortality rates. Therefore, patients preferred to stay at home during the first lockdown due to the fear of COVID-19 contamination. As time passed, however, people became used to the new situation of living with the pandemic and started returning to the ER for less severe conditions. The decreases in the use of hospital services were, therefore, less pronounced during the second lockdown.
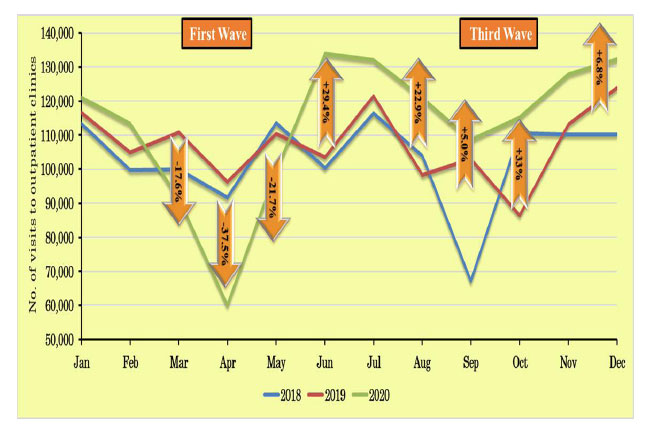
Fig. (3) shows that the trend in outpatient clinic visits in the first wave is similar to that in hospitalizations, but with a significant increase after the first wave (in June 2020), by almost 30% compared to the levels in previous years. During the third wave, the level of clinic visits was 5–33% higher compared to 2019. However, the behavior was the opposite concerning ER room visits, as described in detail above [10-14].
In a similar vein, the Duke University Health System in the United States reported a 33.1% decrease in the number of outpatient cardiovascular visits in the first 15 weeks of the COVID-19 pandemic compared to the same period in 2019. In addition, 53% of visits initially booked were canceled in 2020 compared to 35% of visits canceled in 2019 [15].
3.2. Community Services
Fig. (4) compares the total number of visits to community physicians (primary and secondary) for 2018 to 2020.
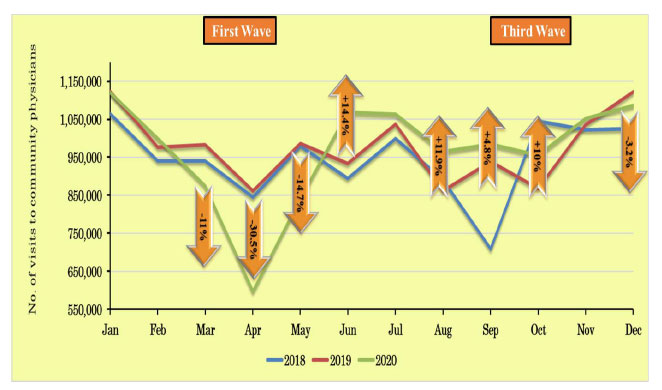
A significant decrease in the number of visits to community physicians (both primary and secondary) was observed in the first wave; however, at the end of the first lockdown, a compensatory increase was noted, the same as observed for outpatient clinic visits. Segmentation of the data into adult and pediatric visits to primary physicians only and adult visits only to primary physicians shows similar trends for overall visits.
Similarly, in Ontario, Canada, the total number of primary care visits between March and July, 2020, compared with the same period in 2019, decreased by 28.0%, from 7.66 to 5.51 per 1,000 people per day [16].
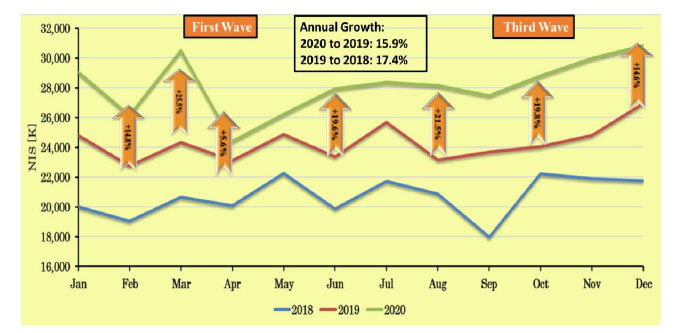
In terms of drug consumption, the data showed no differences in the effects of the different waves (Fig. 5). The mechanism for updating reimbursed drugs according to Israeli national law usually increases drug consumption by 5–10% over two consecutive years. The greater increase of more than 10% is usually connected to previous medication updates, which take more than one year to reach equilibrium.
4. DISCUSSION
The purpose of this article is to investigate Meuhedet Health Services’ health performance and outcomes during the three waves of the COVID-19 pandemic from February, 2020, to January, 2021. Apart from drug consumption, all the data indicated that people shunned medical services during a fast-spreading epidemic that caused significant mortality. It was found that the first wave of COVID-19 was a shock, with a significant reduction in the consumption of health services, but this decrease attenuated with the second wave due to immediate management interventions and safety rules implemented in hospitals and clinics. The Israeli health system’s response in hospitals and community services to the first wave demonstrated adaptive behavior, especially in terms of community physician visits and outpatient clinic visits, which increased to levels even above those in 2018 and 2019.
The results of the data analysis can be used to support decision-making during other pandemics similar to the COVID-19 pandemic and to design new options for community service alternatives to maintain public health regarding non–COVID-19 morbidity.
Future services should be based on digitization and remote services, telemedicine, home lab services, home care, including home hospitalizations, and prescription digitization. These were also some of the immediate steps implemented in Israel’s health system at the start of the COVID-19 pandemic. These new technologies will eventually completely replace the “old system,” based on face-to-face clinic visits. The implementation of digital systems and telemedicine was especially emphasized in community health services to maintain and strengthen physician–patient contact, preventing a sharp reduction in service demand in one wave and a sharp increase afterward. A sharp increase in service demand usually leads to less service availability and patient dissatisfaction. These immediate shifts were adopted by Meuhedet Health Services’ insurers, and after April, 2020, the decreasing trend in services consumption started to reverse and then increase. The main reasons for this outcome are the high numbers of personnel successfully using the health system infrastructure and resources to optimize performance and allaying the public’s fear of using the health care system.
The only services that maintained the same levels as in previous years were medication consumption and delivery. In March, 2020, the pharmacists in the Meuhedet pharmacy chain were instructed to dispense chronic medications for two months (March and April) to avoid patient pharmacy visits in April and eliminate the risk of COVID-19 infection. This explains the high level of consumption in March and the reduction in April. Cooperation between pharmaceutical companies and health and medical organization management is essential in a pandemic to maintain a large inventory for a short period and dispense medications for more than one month at a time for the safety and confidence of the patients.
A dilemma arises, however, from these results in terms of the influence of the COVID-19 pandemic medical quality indicators on the Meuhedet population during the three waves. In a subsequent paper, we will describe a reduction of 3% in the list of medical quality indicators, especially for chronic diseases, with a step backward of two years. The dilemma of the trade-off between lowered health levels and feeling safe at home is dramatic in this regard. The gap between the successful maintenance of health services after the first wave and the reduction in health levels could be explained by the population’s behavioral characteristics (e.g., anxiety and fear).
Although there is little doubt that new tools, such as digitization, remote services, telemedicine, and home care, including home hospitalization, have had a mostly positive effect, it remains to be seen whether other effects, such as the lack of physical examinations and the loss of physical presence and touch, have adversely influenced provider–patient communications, patients’ willingness to disclose concerns that could affect their care, and, ultimately, patients’ health outcomes. Confidence in the health system, especially during the long periods of a pandemic, is crucial for recovering and improving the health level of the population.
4.1. Strengths and Limitations
This research is one of the first studies based on real-world data with a wide overview of the population’s behavior during three waves of the COVID-19 pandemic. The strength of using real-world data in “real-time” can help directors in quickly and efficiently plan health services during situations, such as the COVID-19 pandemic. Regardless of the type of health system structure, effective decision-making and resource allocation must consider real-world data, such as in the allocation of more time for digital services at the expense of regular visits or the allocation of resources to teach senior populations to use digital applications in lieu of in-person visits.
On the other hand, it is important to bear in mind Israel’s unique healthcare population, which differs from that of other countries. For example, 40% of Meuhedet’s patient population is ultraorthodox, and they do not use digital services such as smartphones or the Internet. Since this special population does not adhere to a standard modern lifestyle in their use of digital services, the dramatic shock of the first wave of a pandemic can have very different repercussions on their consumption of health services.
CONCLUSION
Since new variants of COVID-19 or even a new pandemic will be a part of our lives over the next few years, we should learn to adjust our lives accordingly and develop alternative medical services to maintain acceptable health states. Digital services, telemedicine, home care, and remote services must gain priority in health medical organizations to prepare for the next pandemic. In Israel, the public adapted very quickly to the virtual shift in the system, but further research is needed to evaluate the medical outcomes of the new era of services.
LIST OF ABBREVIATIONS
| HMO | = Health Maintenance Organization |
| OECD | = Organisation for Economic Co-operation and Development |
| ER | = Emergency Room |
ETHICAL STATEMENT
This study was approved by the relevant institutional Helsinki committees.
CONSENT FOR PUBLICATION
Not applicable.
AVAILABILITY OF DATA AND MATERIALS
The authors confirm that the data supporting the findings of this study are available within the manuscript.
FUNDING
None.
CONFLICT OF INTEREST
The authors declare no conflicts of interest, financial or otherwise.
ACKNOWLEDGEMENTS
Declared none.

