All published articles of this journal are available on ScienceDirect.

State Public Health Communications and Public Compliance during the Pre-election SARS-CoV-2 Pandemic: Interpreting the Effectiveness of Messaging Guidelines Utilizing Moral Foundations Theory
Abstract
Background:
State-level public health messaging during the pre-election coronavirus pandemic was very inconsistent. Moral motivational content of the messages, as characterized by moral foundations theory, may have contributed to the degree of compliance in particular states. More attention to this content might result in greater compliance and a lessening of the pandemic's severity.
Methods:
A comprehensive review of official state messaging in six U.S. states (California, Florida, Massachusetts, Mississippi, New York, and Texas) was reviewed for the number and distribution of moral foundations as described by moral foundations theory. A search was done for state-level data concerning compliance with mask-wearing and social distancing, the primary public precautionary measures during the pandemic. Rates of compliance by the state were compared with messaging content and analyzed for associations and correlations with the known partisan leanings of the states. Examples of messages with balanced moral foundations, which might be prospectively employed for greater acceptance, were presented. All data were gathered prior to the introduction of the first available vaccine.
Results:
Message review and compliance data suggested that the quantity and proportion of coronavirus-related official messages and the utilization of a balanced combination of moral foundations were associated with higher levels of compliance with the recommended public health measures and lower infection rates. The political orientations of states did not align with the use of known conservative/liberal preferred moral foundations as previously established by Moral Foundations Theory.
Conclusion:
Adjusting messaging with attention to the balanced employment of moral foundations can lead to wider acceptance of and compliance with preventive public health measures.
1. BACKGROUND
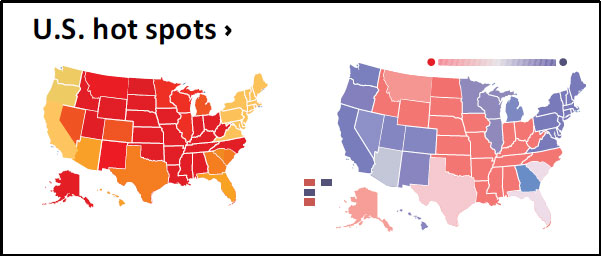
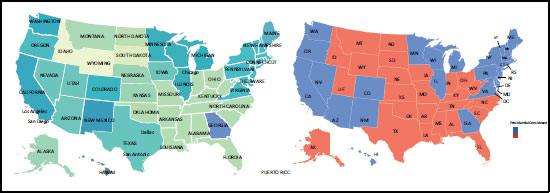
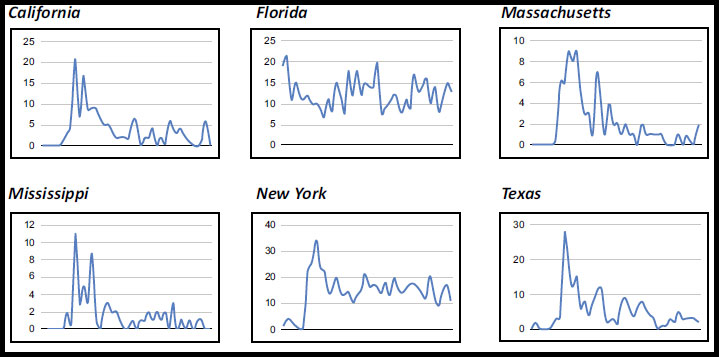
As of the morning of November 3rd, 2020, approximately one month prior to the release of the first vaccine, there were 9,297,353 confirmed cases of the severe acute respiratory syndrome (SARS) coronavirus type 2 (COVID-19, COVID) and 231,599 deaths in the United States (US) [1]. At that time, in terms of mortality, the COVID pandemic ranked third in US history behind an estimated 675,000 deaths from the 1918/1919 Spanish Influenza and some 700,000 caused by the Human Immunodeficiency Virus (HIV) [2, 3]. The response to the pandemic, however, was plagued by incomplete information and inconsistent messaging [4]. While difficulty instituting public safety measures with previous epidemics was not unique- the ‘Anti-Mask League of San Francisco,’ was founded in 1919 as a reaction to influenza precautions-the response to COVID seemed to be particularly politicized [5, 6]. In fact, as of October 30th, 2020, maps of cases strikingly resembled political polling maps for the imminent US election (Fig. 1) [7, 8]. While this relationship clearly must have been a conglomeration of a multiplicity of factors, this certainly warrants examination.
The COVID-19 virus caused the most significant public health crisis in a hundred years and the greatest disruption to global functioning since World War II [9, 10]. It came during an election year already considered by many to be one of the most contentious in US history. Officially released information and experts were frequently doubted, press releases were given with so-called “alternative facts,” media sources were labelled “fake news,” and a proliferation of internet voices with competing opinions added to the noise [11-13]. Public trust had fallen. According to Pew Research, as of September, 2020, more than three times as many Americans felt the government’s handling of public health was ‘very bad’ (35%) than ‘very good’ (11%), and the number of conspiracy theories had exploded [14-16]. In a crisis without established information, such as a pandemic caused by a novel agent, theorizing and a degree of guesswork must be necessary but also undoubtedly lead to uncertainty. High mortality, however, turns any available information into an imperative, even transiently, until better information and better practices are available, a fluid situation that can lead to greater confusion [13].
However, any measure must come with costs, and those with reason to profit from certain approaches would be incentivized to interpret and present the data in a favorable light. The dissemination of information during the early COVID pandemic supports this hypothesis based on traditional political priorities of economic prosperity emphasized by Republicans and government-based public health measures supported by Democrats [17]. These conflicting perspective likely led to more confusion and an increased probability of non-adherence to concurrent safety measures [18].
Early recommendations from the World Health Organization (WHO), the Centers for Disease Control and Prevention (CDC), and other authorities were somewhat fluid. Social distancing, as defined by the maintenance of at least six feet or two meters of space between individuals, and mask-wearing endured, but recommendations for the avoidance of ibuprofen and use of the anti-malarial hydroxychloroquine, among others, were revoked [19-21]. Due to a concern about supply shortages for health care and other frontline personnel, mask wearing by the public was initially discouraged before being mandated, which only added to the confusion [22]. Ultimately, durable official recommendations stabilized on wearing masks, certain business and school closures, travel restrictions, and social distancing [23, 24]. However, as will be shown, the adoption and communication of these measures was non-uniform, presented with varying degrees of force and credulity, and resulted in a plurality of local regimens that included suggestions, recommendations, mandates, and/or advisories subsequently leading to a very heterogenous public response (Appendix D) (Appendix C) [25].
1.1. Moral Foundations Theory
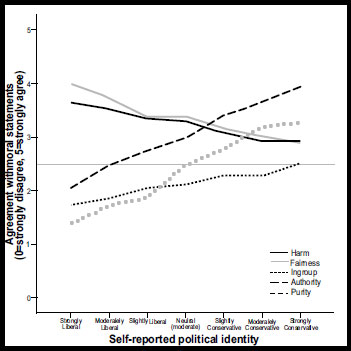
According to Kreuter and McClure, the degree to which messages are accepted depends on a number of factors, among them age, social status, demographics, educational attainment, political affiliation, and personal values [26]. The receptivity of individuals to political messages has previously been examined and discussed in terms of Moral Foundations Theory (MFT), a psychology-based descriptive moral theory [27]. Descriptive moral theories differ from traditional systems in that they observe and describe how people behave in a moral sense, as opposed to a philosophy or religion-based prescriptive moral theory, which states how people ought to behave [27]. MFT describes moral motivation in terms of five foundations of opposing ideas: care versus harm, fairness versus cheating, group loyalty versus betrayal, authority versus subversion, and sanctity versus degradation (Fig. 2). It has previously been shown that appealing to a greater number of these foundations in messaging has been more effective in producing political results and that conservatives and liberals tend to respond to different sets of foundations in messages [28].
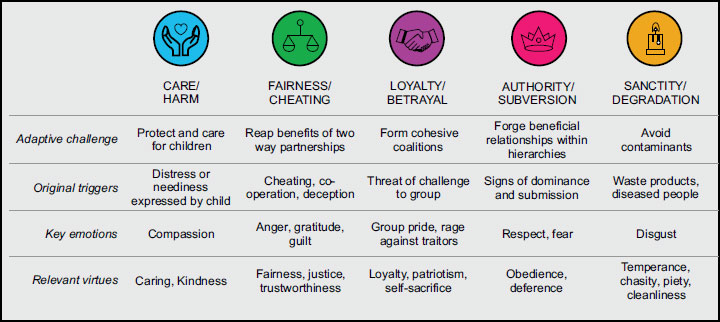
When reporting values, self-identified liberals tend to put greater emphasis on the importance of the Care/Harm and Fairness/Cheating foundations and less on Loyalty/Betrayal, Authority/Subversion, and Sanctity/Degradation, with situational testing supporting the report. Self-identified conservatives, in contrast, reported valuing all of the foundations more or less equally, but when tested with scenarios, tended to respond most strongly to the Authority/Subversion foundation followed by Sanctity/Degradation (Appendix B) [28]. In addition, when a greater variety of foundations is used, a population appears to be more receptive to the message [30]. It may then be inferred that the broader and more balanced the message, the more likely it is to find a sympathetic listener. According to these principles, engineering messages to include foundations that appeal to both political identifications could increase the likelihood of wider acceptance.
2. METHODS
With the recognition of the confounding influence of US national politics in 2020 on this issue, this analysis was specifically confined to the state level messaging for comparability. All conclusions should be understood in the context of conflicting messages from the conservative executive leadership and federal bureaucratic institutions [31]. During this time, national executive leadership had generally downplayed the severity of the pandemic and deemphasized the need for precautionary measures except international travel bans, while the political opposition had criticized and differed with this approach [32]. This analysis was conducted on the four most populous US states, California, Texas, New York, and Florida, conveniently including two with historically liberal leanings (California and New York) and two with conservative leanings (Texas and Florida), as well as Massachusetts and Mississippi, the most liberal and conservative states respectively as determined by registered voter self-identification [33].
2.1. Timeline Creation
For this analysis, all data regarding COVID confirmed cases or death were obtained from the COVID-19 Interactive Dashboard maintained by Johns Hopkins University [1, 34]. Daily numbers from the dashboard were converted into a weekly table on which a compiled timeline of pandemic-related policy actions taken by individual states was layered.
2.2. Messaging Analysis
Officially released public messages from the office of the state executive were examined to determine whether the messaging reflected the concurrent WHO and CDC guidelines. These underwent an assessment to quantify the number and type of the moral foundations as defined by MFT that was utilized within the official messaging per week. To accomplish this, a review of all official messages released from each state governor’s office was conducted. All official messages released within the study time frame were analyzed, tabulated, and evaluated for MFT moral foundations presented as a motivating factor for action, instead ofrepeating recommendations without additional comment. The weekly total of these the number and content of these messages were assembled into a table and analyzed.
2.3. Behavioral Compliance
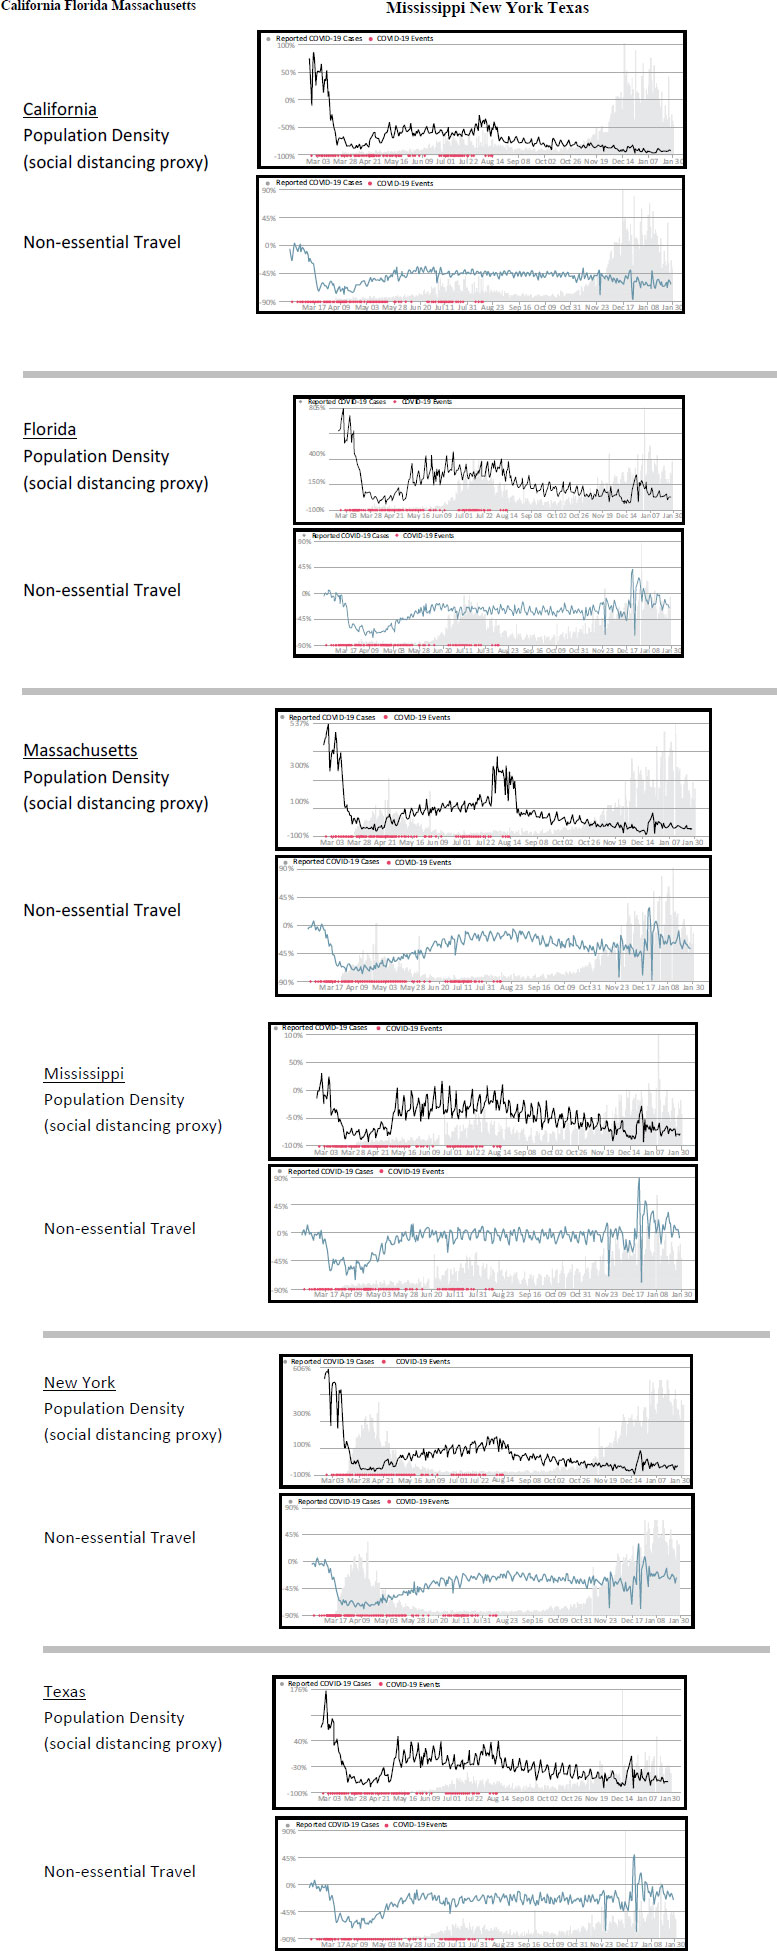
Data concerning state-level compliance were then obtained, reviewed, and compiled in reference to the two most broadly recommended public health measures: wearing face masks and social distancing [35]. These were identified as the primary recommendations of WHO and two of the three top recommendations of the CDC [36]. The effectiveness of messaging was inferred from the behavior of the citizens in the respective states. Two major types of data were found to exist for the purpose of tracking compliance: self-reported assessment surveys and databases with cell phone GPS tracking data that monitored the overall movements and the proximity of cell phone users to others. The cell phone data was in the form of large, de-identified datasets publicly available on the internet. While other assessments of compliance existed, for example the San Francisco Municipal Transportation Agency tracked mask wearing with public transit cameras, these were inconsistent and too specific and contingent to provide comparison [37]. Appropriate public surveys were identified utilizing Google Scholar and employing specific search terms.(Appendix A) The sources were limited to surveys that reported state level data to facilitate comparison. Only data involving direct self-reporting or direct measurements of compliance were noted; published materials consisting entirely of hearsay or opinion concerning compliance were not included.
For a more comprehensive picture of actual-versus-reported compliance and to minimize the problem of reporting bias, several efforts have been made by telecommunications, web-based, and cell phone companies, including Unacast, Google, and Apple, to track movements which were then reported in a dashboard format. Various data were presented, including distances travelled, types of destinations, and proximity to other phones as a proxy measurement for social distancing [38, 39]. These data were used to complement the constructed timelines of cases and policy for a visual comparison.
An analysis was performed with this compliance data and the messaging content to identify relationships between moral foundations use and relative rates of compliance, particularly in proximity to the time of the messages. The analysis created a reasonably comprehensive picture of the context of the messages and the degree to which the quantity and variety of moral inclusions may bear a relationship with population-level public health behavior.
2.4. Messaging Recommendations
The final aim of the analysis was to craft examples of messages that could optimize receptivity based on MFT principles and gain wider acceptance in order to improve compliance with recommendations and diminish the impact of the pandemic. Previously, MFT had been presented as a tool for public health communication [30]. The messages presented here, however, are specific to COVID and crafted deliberately to avoid ideological identification with either party or position on the liberal-conservative spectrum. This might provide a variety of options that could be selected and delivered, either individually or in combination. They are designed with attention to the specific CDC and WHO recommendations as listed below. They can include both the broad measures tracked in the study and the more general recommendations given by each organization.
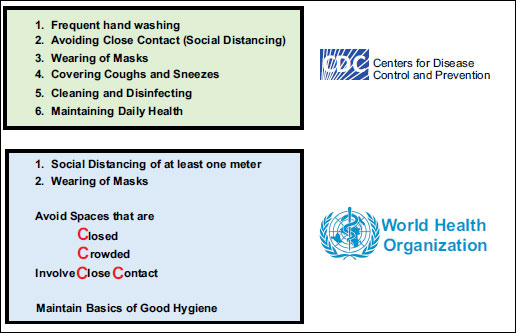
As of November 1st, 2020, the CDC recommended frequent hand washing, avoiding close contact (social distancing), wearing masks, covering coughs and sneezes, cleaning and disinfecting, and maintaining daily health [35]. The WHO primarily recommended social distancing of at least one meter, and mask wearing and secondarily, ‘the 3C’s: spaces that are Closed, Crowded, or involve Close contact,’ as well as maintaining the basics of good hygiene (Fig. 3) [36]. In support, adherence to these measures has resulted in decreased transmission rates and fewer infections throughout the pandemic [37-39].
For the wearing of face masks and social distancing, six messages were created utilizing multiple MFT moral foundations in each. By presenting a foundation targeted at broad value bases, larger populations might be influenced and may see the messages as less political and more scientific. During creation, a conscious effort was made to avoid ideological identification or elements that could be construed as political in nature.
3. RESULTS
State messaging and compliance results were presented initially by individual states, then comparatively. Integrative and interpretive analyses of the data were then presented. Official messages were reviewed on the official press release websites for the governors’ offices of the respective states or as otherwise indicated as a primary source of official messages [40-45].
Search results for survey compliance data revealed numerous surveys that dealt with locale-specific or national data, but only four were identified with comparable state-level data. Three cell phone-based tracking datasets were identified, which provided information on movements and cell phone density used to infer social distancing. These were Unacast, a Norwegian telecommunications company, Google, which used their Maps app to track movements and distancing, and Apple, which also tracked movements by cell phone signal and reported robust longitudinal sub-analyses [46-48]. Rich state and national level data were available from each result are presented below alphabetically by state and in Appendix C.
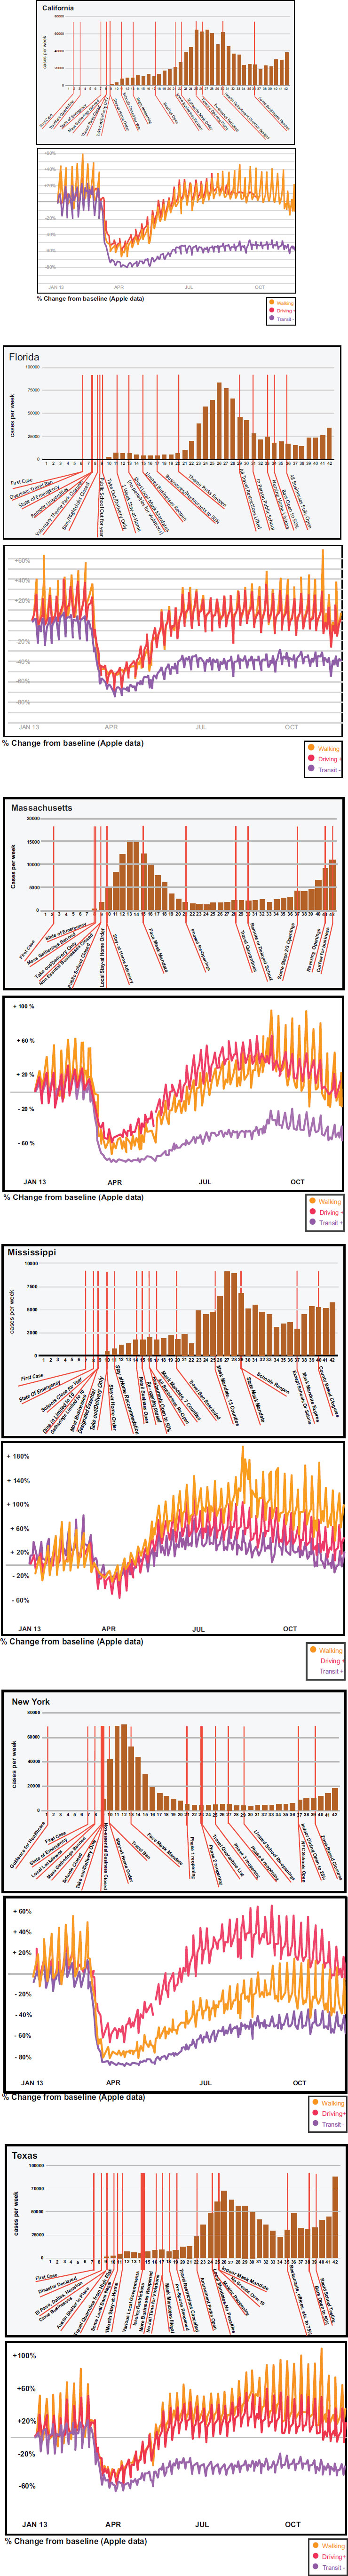
3.1. California
California, a more liberal state, had been the hardest hit in the United States and suffered the highest death toll at the time of writing. The state’s response was complicated by bad publicity, significant public pushback, and reports of non-compliance among state leaders [49, 50]. The state’s public policy measures were among the most aggressive in the nation and may have helped to keep per capita rates of infection and case fatality rates to 8,700 per 100,000 and 1.31%, respectively (Appendix D) [1].
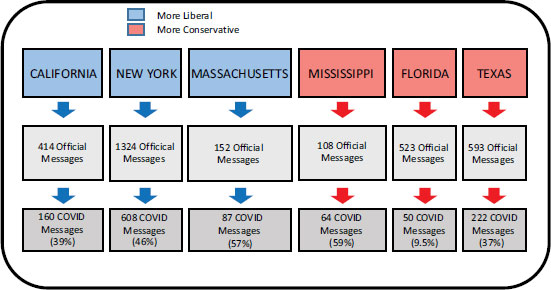
A review of the state governor’s official press releases revealed 414 messages, 160 directly relating to coronavirus [41]. All the MFT moral foundations were employed with the exception of loyalty/betrayal. Frequent use was made of the authority/subversion principle, appealing to the expertise and authority of officials, traditionally more effective with self-identified conservatives (labelled hereafter as ‘cons’) and care/harm, utilizing direct appeals for safety and care of oneself and one’s loved ones, traditionally more effective with self-identified liberals (labelled hereafter as ‘lib’) [28]. This pattern was persistent throughout the messaging period. (Appendix C).
California instituted a state-wide mask mandate from June 18th through the election. The COVID Impact Survey reported 91% of people wore masks in April, increasing to 97% by June (national comparison 78% and 90%) [51]. Delphi’s COVID-Cast Dashboard data showed that between 90.5% and 92.2% of respondents reported wearing a mask all the time, with a large geographic difference observed with coastal and urban counties reporting up to 98% and the rural inland counties reporting as low as 75% [52]. The YouGov Survey from March 26-April 29 2020 showed that 52% reported wearing masks all or most of the time (national average 43%) [53].
The COVID Impact Survey also found that 87% reported social distancing in April and 86% in June [51]. Google data showed reductions of cell phone presence in locations by GPS markers of 38% at retail and recreational destinations, 22% at grocery stores and pharmacies, 47% at parks, 56% in transit stations, 42% in workplaces, and 18% increase in residences [47]. Apple GPS cell phone movement data showed a 12% reduction in driving, a 16% reduction in walking, and a 58% reduction in public transit utilization, with a much stronger effect in the initial month and subsequent normalizing of both driving and walking patterns, but not public transit [48]. Unacast tracking data showed a 40-55% decrease in distances traveled during the timeframe with an inferred 65-70% decrease in apparent non-essential travel. The Unacast COVID-19 Social Distancing Scoreboard awarded California an overall grade of C minus [46]. According to the Precise Global Impact Study, by April 10th, 2020, 45.3% of Californians reported being extremely familiar with social distancing and 68.2% agreed with concurrent social distancing guidelines, and 80% reported a belief that social distancing helped to prevent or limit spread (Appendix C) [54].
These data suggest that Californians tended to observe mask-wearing but were somewhat less attentive to social distancing. Though they registered significant drops in rates of COVID that correlated with initial public acceptance, this effect appears to have been reversed by mid-summer with a rise in cases (Appendices C and D) [55-57].
3.2. Florida
The response from Florida, a conservative-leaning state, was complicated by allegations of misrepresented infection and death rates, widespread resistance to business and school closures, and a state government-level opposition to more aggressive local containment measures [58]. Based on excess mortality data, it is estimated that deaths from COVID based exceeded officially reported deaths by more than twenty percent [59]. The initial response had been fairly robust, but prioritization of economic interests led to an early relaxation of restrictions culminating in a mandated suspension of all locally assessed fines for non-compliance and the notable absence of any state-wide mask mandate [55-57].
The state government of Florida delivered both the fewest number of COVID messages overall and the smallest proportion of official messaging devoted to COVID despite being a large, populous state with a high number of both cases and deaths. In total, 523 official press releases were issues during the study timeframe, but only 50 of these less than ten percent--were related to COVID. In addition, the messages tended to be sporadically delivered and not temporally related to rates or events in the state, in contrast to other states (Appendix C) [42]. Despite the low volume of communications, the distribution of MFT foundations developed a pattern similar to the other large states with primary emphases on care/harm (lib) and authority/subversion (cons) foundations. The early messages, in particular, relied almost exclusively on the authority/subversion dimension.
Florida was one of the few states not to introduce a state-wide mask mandate. The COVID Impact Survey reported 78% rates of self-reported mask-wearing in April and 91% in June (national comparison 78% and 90%) [51]. Delphi’s COVID-Cast Dashboard data showed between 83.9% and 88.8% of respondents reported wearing a mask all the time, with a 30 percentage point difference between rates in urban Miami-Dade county and the more conservative rural northern panhandle counties. Additionally, the reported rates in the rural areas dropped to their nadir just prior to the election [52]. The YouGov Survey showed 44% reported wearing masks all or most of the time (national average 43%) [53].
The COVID Impact Survey found that 87% of respondents reported socially distancing in both April and June [51]. Google data showed reductions in cell phone’s by 22% in retail and recreational locations, 14% in grocery stores and pharmacies, 25% in parks, 37% in transit stations, and 27% at workplaces, with a 9% increase in residences [47]. Apple data showed a 2% increase in driving, an 8% increase in walking, and a 32% reduction in public transit utilization. Longitudinal data throughout the period showed an initial drop in all three, but by the mid-summer, when the state was experiencing a surge of cases and deaths, Floridians were walking and driving more often than the baseline, though they continued to avoid public transit [48]. Unacast tracking data showed a 40-55% decrease in distances traveled during the timeframe and a 60-65% decrease in apparent non-essential travel. The Unacast COVID-19 Social Distancing Scoreboard awarded Florida’s response an overall grade of F [46]. According to the Precise Global Impact Study, by April 10th, 2020, 43.4% of respondents were extremely familiar with social distancing guidelines, 68.5% reported agreement with them, and 66.7% reported a belief that social distancing was helpful in the prevention and limitation of spread [54].
Florida’s results reflect a relative de-emphasis of the severity of the pandemic that extended to the discouragement of local containment measures in favor of economic concerns. This was associated with apparently low levels of compliance, including what seems to be a complete disregard for social distancing after the first few months.
3.3. Massachusetts
Massachusetts, hard hit by the initial wave of COVID cases in the US, instituted an aggressive initial response with a multidisciplinary public health response. This predominantly liberal state with a conservative governor did manage to avoid the mid-summer surge of cases that affected much of the rest of the US while initiating a four-phase reopening plan, only to have cases rise again in the autumn along with the rest of the country.
During the study time frame, the state governor’s office released 152 messages, 87 of which related to coronavirus [44]. The messages tended to be dry and informational. Still, they did employ to some extent all of the MFT moral foundations, most commonly fairness/cheating (lib) and sanctity/ degradation (cons), which often took the form of admonishments to remain infection free in order to help protect others, framed as a civic duty.
Massachusetts was one of the earliest states to introduce a state-wide mask mandate on May 6, 2020. Delphi’s COVID-Cast Dashboard data showed that 93.0% and 96.0% of respondents reported wearing a mask all the time without significant differences between liberal, urban Boston and the more conservative rural areas [52]. The YouGov Survey reported that 46% of people reported wearing them all or most of the time (a national average 43%) [53].
In terms of social distancing and reduction of unnecessary travel, Google cell phone mobility data showed reduced cell phone concentrations of 38% in retail and recreational destinations, 24% in grocery stores and pharmacies, 48% in parks, 62% at transit stations, 40% in workplaces, and an increase of 18% in residences [47]. Apple data showed a 36% reduction in movement data consistent with driving, a 39% reduction in walking, and a 63% reduction in public transit use, all dropping sharply in the initial months, rising somewhat over the summer, and then decreasing again in the fall when cases began to rise again [48]. Unacast tracking data showed a 40-55% decrease in distances traveled during the timeframe, including a 65-70% decrease in apparent non-essential travel. The Unacast COVID-19 Social Distancing Scoreboard awarded Massachusetts an overall grade of C minus [46]. According to the Precise Global Impact Study, by April 10th, 2020, 48.7% of respondents were extremely familiar with social distancing, 69.6% agreed with the relevant guidelines, and 100% reported a belief that social distancing measures were helping to prevent or limit spread of the virus. (Appendix C) [54].
These data suggest that, in general, the residents of Massachusetts responded vigorously to recommendations but did relax their guard following the initial surge. Cases remained low throughout the summer. When they began to rise again later in the year, the data suggest that people were again more observant of the recommendations. (Appendix D)
3.4. Mississippi
Conservative Mississippi focused primarily on preserving business practices to protect economic interest but also took focal preventative measures, including statewide and targeted county-specific restrictions [60]. Of note, though they did not go so far as to close businesses, they did have generally aggressive early restrictions on large gatherings. In official messaging, they frequently deferred to US national CDC guidelines as the standard, including the closure of all ‘non-essential’ businesses, but then circumvented the rule by designating nearly every business ‘essential.’
The messaging was limited and often focused on optimistic news, such as highlighting the voluntary contributions of local businesses to help combat the pandemic [45]. During the period, Mississippi had the smallest number of total official messages on any topic, and transitioned official releases to the governor’s Facebook page towards the end of the period, redirecting from the state’s official website [61]. The state’s limited messaging did appeal to all five moral foundations with a tendency to rely more heavily on the fairness/cheating foundation (lib). There were no messages that broadly encouraged wearing face coverings, rather, they released assurances that the limited local mandates would be temporary in nature. (Appendix C)
Mississippi’s local measures included county-specific mask mandates, initially in 7 of 82 counties on May 12th followed by 13 counties on July 11th [60]. They instituted a brief state-wide mandate on August 4th during a large surge of cases, but allowed it to expire on September 30th for all locations except schools and certain “close contact” businesses such as salons or barber shops. On Delphi’s COVID-Cast Dashboard, data showed that between 79.0% and 87.2% of respondents in the state reported wearing a mask all the time [52]. The YouGov Survey showed that from March 26-April 29, 2020, 44% reported wearing them all or most of the time (a national average 43%) [53].
In terms of social distancing and reduction of unnecessary travel, Google data showed reduced cell phone concentration of 15% in retail and recreational venues, 15% in grocery stores and pharmacies, 13% in parks, 3% at transit stations, 19% in workplaces, and a 6% increase in residences [47]. Apple data showed a 19% increase in cell phone movement consistent with driving, a 60% increase in walking, and a 15% reduction in public transit. The trend of these data showed only a minimal initial deflection toward less mobility, but then a rapid rebounded to achieve an overall increase in travel and socialization during the period [48]. Unacast data showed a 25-40% decrease in distances traveled during the timeframe with a 55% decrease in non-essential travel. The Unacast COVID-19 Social Distancing Scoreboard awarded Mississippi an overall grade of D minus [46]. The Precise Global Impact Study showed that by April 10th, 2020, 33.9% were extremely familiar with social distancing, but only 59.0% agreed with the guidelines. (Appendix C) [54].
Overall, these data suggest that of the states examined, Mississippi appeared to be the least adherent to both mask use and social distancing. The small initial decreases in mobility and distancing initially were followed by a rebound resulting in more socializing than before the pandemic. The messages from the leadership seemed to lack a cautionary tone and were exceptionally sparse in comparison to most of the other examined states, Florida being the exception. The instituted restriction seemed designed to minimize the pandemic's economic disruption rather than limit the spread of disease. (Appendix D).
3.5. New York
New York was, by far, the hardest hit US state during the initial wave despite aggressive and robust local and state responses. These were instituted early, but likely too late to significantly blunt the curve and reduce rates of infection [62]. New York closed businesses, schools and entertainment venues early. They instituted a mask mandate on April 17th, a measure somewhat delayed by concern that the supply of personal protective equipment (PPE) for frontline workers would be compromised by a public rush [22]. In addition, New York was slow later to relax restrictions and reopen businesses. As a result, once the first wave had passed, New York enjoyed one of the lowest transmission and death rates in the country throughout the summer of 2020. These rates began to rise somewhat later in the year with the rest of the country [1].
New York’s public messaging was delivered in much higher volume and concentration than any of the other states. A review of official press releases revealed 1,324 messages during the analysis time frame, with 608 directly related to coronavirus cases and measures. Many of the messages, though, were secondary press releases and transcripts from the additional media attention drawn by New York Governor Andrew Cuomo’s televised daily addresses [40]. The messages employed all five moral foundations, though with somewhat less reliance on fairness/cheating (lib) and loyalty/betrayal than the other dimensions. New York strongly emphasized the authoritative position of scientific experts (authority/subversion (cons)) as a motivational factor, and avoidance of illness and injury (care/harm (lib)) for individuals and their families. Use of fairness/equity (lib) increased through August and September, themes that became more common with other unrelated news in 2020 (Appendix C) [63].
The COVID Impact Survey published that 93% of respondents in the state reported wearing a mask in April, increasing to 98% in June (national comparison 78% and 90%) [51]. Delphi’s data showed that between 90.5% and 92.2% of respondents reported wearing a mask all the time, with a large geographic difference between New York City, generally more liberal, at 96%- 99%, and the less urban remainder of the state, which averaged 81.9% [52]. The YouGov Survey from March 26-April 29 showed 52% of respondents reporting wearing masks all or most of the time (national average 43%) [53].
The COVID Impact Survey also found that 91% reported social distancing in April, which decreased to 89% by June [51]. Google data showed cell phone concentration reductions of 42% in retail and recreational locations, 23% in grocery stores and pharmacies, 52% in parks, 55% at transit stations, 39% in workplaces, and a 17% increase in remaining in personal residences [47]. Apple cell phone data patterns showed a 55% reduction in driving, a 71% reduction in walking, and a 68% reduction in public transit, with a strong response in the initial months, followed by a partial rebound during the summer, and a subsequent decrease again in the fall concurrent with rising cases [48]. Unacast data showed a 55-70% decrease in distances travelled during the study timeframe, including a >70% decrease in non-essential travel. The Unacast COVID-19 Social Distancing Scoreboard awarded New York State an overall grade of D plus [46]. According to the Precise Global Impact Study, by April 10th, 53.1% of respondents were extremely familiar with social distancing and 72.2% agreed with the guidelines. 100% of respondents believed that social distancing helped prevent or limit the spread of the virus. (Appendix C) [54].
The response in New York was the most robust of the states studied. An initially overwhelming number of infections and deaths likely contributed to the acceptance of and compliance with guidelines. Messages were frequent and well-publicized, and unlike other states, New York was much slower to relax safety measures in the summer. By the end of the study period, cases in the state had risen only slightly (Appendix D).
3.6. Texas
The response in Texas was broadly characterized by aggressive local responses in the larger cities such as Austin and Houston, and controverting statewide limitations of those responses with measures to protect economic interests over public health preferentially [64]. Texas did institute a state-wide mask mandate on July 3rd, 2020. Like Florida, excess mortality data is incongruent in Texas, suggesting that nearly 30% of the deaths from COVID went unattributed to the virus [59]. Based on these numbers, it is likely that by the end of the data collection period, Texas, the second most populous state in the US, had more cases and deaths due to COVID than any other state [1, 59].
The state’s official press releases during the period contained 593 messages, 222 related to COVID [43]. These messages revealed frequent use of the authority/subversion (cons) foundation and to a lesser extent, fairness/cheating (lib), care/harm (lib), and sanctity/degradation (cons). The use of these foundations was consistent throughout the study period. Many messages deferred responsibility for social and economic costs to the authorities at the national level which created recommendations. (Appendix C).
Texas instituted a state-wide mask mandate from July 3rd, 2020 through the election, with numerous municipalities preempting their policies prior to that date [65]. The COVID Impact Survey reported that 76% of respondents reported wearing a mask in April and 90% did in June (national comparison 78% and 90%) [51]. Delphi’s COVID-Cast Dashboard data showed between 86.4% and 88.6% of respondents reported wearing a mask all the time with a large urban/rural split, 93%-98% in the cities versus percentages in the 70’s in the rural counties [52]. The YouGov Survey showed that 43% reported wearing masks all or most of the time (a national average of 43%) [53].
The COVID Impact Survey also found that 85% of respondents reported socially distancing in April, which remained stable at 86% by June [51]. Google data showed movement reductions of 19% in retail and recreational locations, 13% in grocery stores and pharmacies, 22% in parks, 29% at transit stations, 29% in workplaces, and a 10% increase in time spent at a residence [47]. Apple cell phone tracking data showed a 3% increase in driving, an 18% increase in walking, and a 40% reduction in public transit use, characterized by a moderate reduction in the first few months and rebound to and exceeded the baseline in the cases of driving and walking, but not public transportation [48]. Unacast data showed a 40-55% decrease in distances travelled during the timeframe, with a 60-65% decrease in non-essential travel. The Unacast COVID-19 Social Distancing Scoreboard awarded Texas an overall grade of F [46]. According to the Precise Global Impact Study, by April 10th, 48.4% of Texans reported being extremely familiar with social distancing guidelines and 73.8% agreed with them, though only 40% reported believing that such guidelines helped to prevent or limit the spread. (Appendix C) [54].
4. DISCUSSION
A pandemic's success must be measured in low case counts and lives saved. In regard to these two metrics, significant differences exist between the examined states. (Table 1) [1].
| State | Cases per 100k |
|---|---|
| California | 8.734 |
| Florida | 8.373 |
| Massachusetts | 7.964 |
| Mississippi | 9.534 |
| New York | 7.732 |
| Texas | 8.729 |
No discussion can proceed without a profound recognition of the strong influences of national politics on message tone and the partisan leanings of the audience on receptivity to public health information. On November 3rd, US election day 2020, the likelihood of a respondent wearing a mask all or most of the time across the nation, with only a few exceptions, closely mirrored the ultimate elector map for the US presidential election. (Fig. 4) It has also been shown that political affiliation was an independent risk factor for mortality from COVID [66].
The influence of the election may also suggest why six conservative states decided to wait to issue mask mandates until just after the election [68, 69]. Within the United States, one study showed that mask mandates had been effective in decreasing the daily COVID growth rate by 2% at 21 days, and the mandates in place before May 22, 2020 were estimated to have averted approximately 200,000 cases [37]. World-wide, countries with government policies and cultural norms supporting face mask use were shown to have mortality rates approximately four times less than those that did not [38]. Another study from July, 2020 found that only a 10% increase in self-reported mask wearing and social distancing increased the odds of transmission control by 3.5 times [39].
Comparing compliance data between states revealed a consistent split between liberal and conservative states (Table 2). The three liberal states were all more likely to self-report adherence to mask use and social distancing recommendations. More objective cell phone data supports these self-reported data as all the liberal states appeared to have adhered much more closely to the recommendations (Table 3). After the initial 2 months, the conservative states seemed not to distance at all over baseline, and in the case of Mississippi, even to have distanced less than at baseline. (Appendices C,D) Additional survey data reported that the most adherent locale in the country was the strongly liberal District of Columbia, and the least was the strongly conservative State of Wyoming [46].
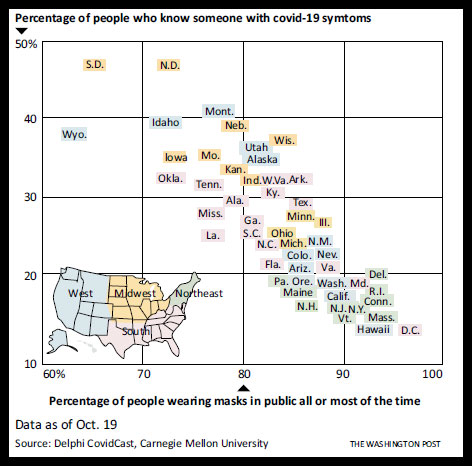
These findings are supported by a broader analysis based on the COVID Cast Dashboard that showed that the number of those who self-reported wearing masks consistently was inversely associated with the number who knew someone with COVID symptoms (Fig. 5) [47].
Results on messaging, however, showed that previously demonstrated conservative/liberal differences in the use of MFT moral foundations trends were not borne out in these press releases. Most of the states tended to appeal to the same moral foundations, suggesting that the subject matter and context of these messages may be naturally more suited to certain approaches and appeals. Authority/subversion, traditionally more often resonant with conservatives, was the most utilized MFT foundation in California, New York, and Texas, while all six states tended to make little use of loyalty/betrayal, a foundation lacking a previously establish ideological association [28]. As reflected in the individual messages, the nature of a public health crisis and the uncertainty associated with a novel problem seems to create a necessity to defer to authorities figures with better qualifications to choose interventions, and an obvious necessity to focus on health, protection, fairness, and cleanliness. Also, not surprisingly, liberals, with platforms perceived to be more supportive of scientific positions and programs, created messages focused on the available science and expert recommendations, while many more of the conservative messages, traditionally perceived as more protective of business interests, focused on balancing public safety concerns against economic harms.
Most states, except Florida, tended to message aggressively in the initial weeks of the pandemic. The liberal states seem to sustain this level over the study period more than the conservative states (Appendix C). New York stands out for messaging certainly for a multiplicity of reasons which included an early heavy pandemic burden with corresponding media coverage, the fact that urban populations, in general, have been shown to be at greater risk due to population density, and because liberal cities are known for more trust in scientific experts and information [70]. The state was the most prolific in messaging and, of the examined states had the highest reported rates of compliance, and, after the initial wave, the lowest incidence of new infections. The state messaged aggressively with a heavy reliance on MFT authority/subversion (cons) and care/harm (lib) foundations while relaxing restrictions very slowly. The presence of balanced foundations that have been shown to appeal to both conservative and liberal minded people may have contributed to its success. In contrast, Mississippi messaged the least, had the weakest restrictions, focused strongly on preserving businesses and relaxing measures, and also, had the highest incidence rate of infections. (Appendix D) [71].
Table 4.
| Mask Wearing | Care Harm |
Fair.
Cheat. |
Loyalty Betray. |
Author.
Subver. |
Sanctity Degrad. |
|---|---|---|---|---|---|
| “Wearing masks not only helps to protect yourself and your family from COVID and other viruses, but it keeps your insides as clean and virus free as the hands you wash every day.” | X | X | - | - | X |
| “Masks, it’s what we do here in the Great State of X to rise above the rest. Take care of your fellow X-ans/ites/ers by wearing a mask. Not only does it make us stronger, but it’s just the right thing to do.” | X | X | X | - | - |
| “Governor X says masks are what we need to be doing. He/She and his/her panel of experts know that we have a responsibility to each other to make this the best place to live in the whole world.” | - | X | X | X | - |
| “Masks help protect you and your parents and your children from the devastating COVID pandemic. With all you do for your family, your friends, and your community, don’t you owe it to them to do this too?” | X | X | X | - | - |
| “When you wear a mask to keep out the invisible corruption of COVID, you are a soldier in Governor X’s and the State of Y’s battle with this evil pandemic. Protect your fellow soldiers and let’s win this fight!” | - | X | X | X | X |
| “Scientists know that masks can keep you healthy and out of the hospital, but did you know it keeps your neighbors out too? Let’s support each other and protect each other, and we’ll get through this! X-state strong!” | X | X | X | - | - |
| Social Distancing | - | - | - | - | - |
| “Absence makes the heart grow fonder. Loving your family in this time may mean distancing so you can love them for many days to come. Keep them safe, keep them healthy, keep them clean. Socially distance.” | X | - | - | - | X |
| “When the CDC and Governor X remind us to socially distance, they know it’s the best way to protect each other and ensure that X State remains the best and strongest place to be.” | - | X | X | X | - |
| “Back off! Keep yourself safe and healthy, keep yourself clean, you owe it to yourself and your neighbor. Anti-social is the new social!” | X | X | - | - | X |
| “Nasty little germs can’t catch you from six feet away, and Coach Governor X tells us our team won’t let these germs take over our state. Do it for the team, keep us clean!” | - | X | X | X | X |
| “Needing a ventilator to breathe is no way to live, and worse, it’s no way to die. Not for you, not for your family, not for the lady across town. Let’s do this together and apart. Socially distance.” | X | X | X | - | - |
| “The only way to make our state great again is to come together on staying apart. Keep yourself clean and healthy, and help your neighbor do the same. Wouldn’t you want him to do the same for you?” | X | X | X | - | X |
Based on the official messaging in this analysis, the inference of an association between the partisan leanings of the state and the appeal to populations with the use of MFT foundations previously identified to be effective with those respective political ideologies is not supported. However, it does appear that there is an association between the volume of messaging and rates of compliance. In addition, an association might be inferred between messaging containing elements found to be appealing to both conservatives and liberals and overall rates of compliance. Prior studies have shown that the variety and quantity of moral foundations within messages resulted in political success. Therefore, it is consistent with prior knowledge to conclude that the balance of foundations present in the messages could, in part, be responsible for the improved response. It appears from the limited data that more messages with more balanced foundations might result in improved compliance with precautionary guidelines, which have been demonstrated to lead to lower rates of infection and subsequent deaths.
This finding suggests that it would be useful to have messages available that appeal to multiple foundations that might be crafted with attention to the avoidance of triggering partisan rhetoric in order to make them useful for leaders of all ideologies and in all positions [28-30]. Such an effort could be tailored to changeable content, particular interventions, or priorities of the communicator. It would be advisable, in order to avoid the politicization of safety concerns and to the extent possible, to separate admonitions aimed at encouraging public health behaviors from those intended to serve some other purpose, such as economic prosperity. Examples of balanced messages that could be directly utilized or modified as needed are given in Table 4.
Strengths of this analysis include large amounts of data from multiple diverse sources, both subjective in the form of self-reported items and objective in the form of tracked cell phone data allowing a wide context in which to interpret results. A major weakness of the study is that it doesn’t account for federal-level messaging which likely had a greater influence than state level in many places. Another is that the number of available studies reporting state-level data was limited. For a more robust analysis, similar data might be compared from all fifty states and to include federal or nationally publicized messages. Another weakness is that it does not account for confounders such as urbanization, education, socioeconomic status, or geographic and temporal distributions affecting attitudes and responses. Additionally, in the year 2020 in particular, a high degree of distrust of specific media sources likely influenced receptivity and compliance for many. Lastly, though similar moral foundations were used in both liberal and conservative states, liberal states nonetheless tended to have much better rates of compliance, suggesting there may be other factors potentially associated with a political ideology that encourage acceptance or rejection of proactive public health measures or restrictions [72-80].
CONCLUSION
Examination of official messaging during the pre-election COVID-19 pandemic suggests an association between the volume of messaging and the variety, balance of MFT moral foundations, and public compliance. These findings suggest that by appropriate attention to MFT-based crafting of messages, greater levels of compliance might be achieved, which could result in improved outcomes.
LIST OF ABBREVIATIONS
| CDC | = Centers for Disease Control and Prevention |
| Cons | = Conservative |
| GPS | = Global Positioning System |
| HIV | = Human Immunodeficiency Virus |
| lib | = Liberal |
| MFT | = Moral Foundations Theory |
| PPE | = Personal Protective Equipment |
| SARS | = Severe Acute Respiratory Syndrome |
| SARS-CoV-2 | = Severe Acute Respiratory Syndrome Coronavirus type 2 |
| US | = United States |
| WHO | = World Health Organization |
ETHICS APPROVAL AND CONSENT TO PARTICIPATE
Not applicable.
HUMAN AND ANIMAL RIGHTS
No animals/humans were used for studies that are the basis of this research.
CONSENT FOR PUBLICATION
Not applicable.
AVAILABILITY OF DATA AND MATERIALS
The data that support the findings of the study is available from the corresponding author [J.F.H] on reasonable request.
FUNDING
None.
CONFLICT OF INTEREST
The author declares no conflict of interest, financial or otherwise.
ACKNOWLEDGEMENTS
Declared none.
Appendix A
Search terms for compliance review:
Compliance + mask
Compliance + social
Compliance + distancing
Compliance + travel
Compliance + tracking
Compliance + cell phone
Social distancing + cell phone
Cell phone + data + coronavirus
Cell phone + data + COVID
Mask + survey
Mask + compliance + survey
Mask + compliance + survey + state
Mask + compliant + survey
Mask + compliant + survey + state
Coronavirus + compliance
COVID + compliance + state
Mask + compliance + state
Distancing + compliance + state
COVID + cellphone + distancing
Coronavirus + cellphone + distancing
Appendix B
Figure B1
This graph describes the self-reported importance of each dimension of moral foundations in the decision making process for each self-reported liberal-conservative position on the ideological spectrum. As shown, generally, those who identified as more liberals rely more on the foundations of care/harm and fairness/cheating, de-emphasizing the remaining three, while those who identified as more conservative tended to feel that they all were equally important to the decision.23
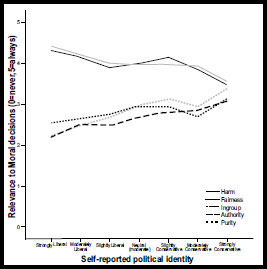
Figure B2
This graph describes the actual importance shown of each moral dimension when tested by agreement with particularly worded statements plotted against self-reported liberal-conservative position on the ideological spectrum. As shown, while self-identified liberal foundations tended to agree with their self-reported importance of each dimension above, except perhaps for an underestimated importance of the authority/subversion, self-identified conservatives strongly emphasize the importance of authority/subversion, and to a lesser extent purity (sanctity/degradation) when actually making decisions over the remaining dimensions.23
Appendix C
| - | California | Florida | Massachusetts | Mississippi | New York | Texas | |
|---|---|---|---|---|---|---|---|
| COVID Impact Survey | |||||||
| mask use | - | - | - | - | - | ||
| April | 91% | 78% | NA* | NA* | 93% | 76% | |
| May | 92% | 84% | NA | NA | 95% | 90% | |
| June | 97% | 91% | NA | NA | 98% | 90% | |
| social distancing | - | - | - | - | - | ||
| April | 87% | 87% | NA | NA | 91% | 85% | |
| May | 87% | 91% | NA | NA | 92% | 93% | |
| June | 86% | 87% | NA | NA | 89% | 86% | |
| Delphi COVIDCast (9/8-11/3) | |||||||
| mask use high | 92.20% | 88.80% | 96.00% | 87.20% | 94.30% | 88.60% | |
| mask use low | 90.50% | 83.90% | 93.00% | 79.00% | 91.40% | 86.40% | |
| - | - | - | - | - | - | - | |
| YouGov (3/26-4/29) | |||||||
| mask use | 52% | 44% | 46% | 44% | 53% | 43% | |
| Premise Global Impact Study (3/15-4/10) | |||||||
| Extremely familiar with social distancing | 45.30% | 43.40% | 48.70% | 33.90% | 53.10% | 48.40% | |
| social dist. strongly agree | 31.50% | 31.20% | 21.50% | 30.40% | 34.20% | 31.40% | |
| social dist. agree | 36.70% | 37.30% | 48.10% | 28.60% | 38.60% | 42.40% | |
| agree: distancing helps | 80% | 66.70% | 100% | NA | 100% | 40% | |
| Google MAPs data | |||||||
| Retail and Recreation | -38% | -22% | -38% | -15% | -42% | -19% | |
| Grocery and Pharmacy | -22% | -14% | -24% | -15% | -23% | -13% | |
| Parks | -47% | -25% | -48% | -13% | -52% | -22% | |
| Transit Stations | -56% | -37% | -62% | -3% | -55% | -29% | |
| Workplaces | -42% | -27% | -40% | -19% | -39% | -29% | |
| Residential | up 18% | up 9% | up 18% | up 6% | up 17% | up 10% | |
| Apple Data (1/13-11/3) | |||||||
| Driving | -12% | up 2% | -36% | up 60% | -55% | up 3% | |
| Walking | -16% | up 8% | -39% | up 19% | -71% | up 18% | |
| Transit | -58% | -32% | -63% | -15% | -68% | -40% | |
| Unacast COVID-19 Dashboard | |||||||
| Overall Grade | C- | F | C- | D- | D+ | F | |
| - | California | Florida | Mass. | Miss. | New York | Texas |
|---|---|---|---|---|---|---|
| Messages (no.) | 414 | 523 | 152 | 108 | 1324 | 593 |
| COVID Messages (no.) | 160 | 50 | 87 | 64 | 608 | 222 |
| % | 38.65% | 9.56% | 57.24% | 59.26% | 45.92% | 37.44% |
| Care/Harm | 63 | 18 | 13 | 14 | 261 | 84 |
| % COVID message | 39.38% | 36.00% | 14.94% | 21.88% | 42.93% | 37.84% |
| Fairness/Cheating | 16 | 7 | 33 | 33 | 71 | 34 |
| % COVID message | 10.00% | 14.00% | 37.93% | 51.56% | 11.68% | 15.32% |
| Loyalty/Betrayal | 0 | 2 | 11 | 8 | 1 | 4 |
| % COVID message | 0.00% | 4.00% | 12.64% | 12.50% | 0.16% | 1.80% |
| Authority/Subversion | 101 | 10 | 5 | 11 | 283 | 91 |
| % COVID message | 63.13% | 20.00% | 5.75% | 17.19% | 46.55% | 40.99% |
| Sanctity/Degradation | 17 | 5 | 28 | 14 | 237 | 42 |
| % COVID message | 10.63% | 10.00% | 32.18% | 21.88% | 38.98% | 18.92% |
California Florida Massachusetts
Mississippi New York Texas
California
Population Density
(social distancing proxy)
Non-essential Travel
Florida
Population Density
(social distancing proxy)
Non-essential Travel
Massachusetts
Population Density
(social distancing proxy)
Non-essential Travel
Mississippi
Population Density
(social distancing proxy)
Non-essential Travel
New York
Population Density
(social distancing proxy)
Non-essential Travel
Texas
Population Density
(social distancing proxy)
Non-essential Travel