All published articles of this journal are available on ScienceDirect.

Nutritional Status, Anemia and Eating Behavior among Children with Elevated Blood Lead Levels in a Primary Health Care of Peru
Authors Info & Affiliations
Abstract
Aim:
Malnutrition, anemia, and lead exposure are important public health problems.
Introduction:
To assess nutritional status, anemia, and eating habits and their relationship to elevated blood lead levels in children.
Materials and Methods:
Descriptive study conducted with data from children evaluated in a district of Callao, Peru. The variables studied were: nutritional status, based on anthropometric measurements; anemia, determined by blood hemoglobin concentration; dietary habits, evaluated by the 24-hour dietary recall method and food consumption frequency; and blood lead, determined by LeadCare II analyzer.
Results and Discussion:
A total of 425 children participated, with a median age of 6 years (IQR=5; Q3=9, Q1=4), 52.2% (n=222) were female and 71.3% (n=303) had blood lead level (BLL) ≥5μg/dL. Among children with BLL ≥5 μg/dL, 11.6% (n=35) presented poor nutritional status, 9.9% (n=30) had anemia, and 63% (n=191) had inadequate eating habits. Of the children with inadequate eating habits, 17.4% (n=47) had poor nutritional status and 15.9% (n=43) had anemia, compared to children with adequate eating habits (p<0.001). In children with BLL ≥5 μg/dL, the children's median hemoglobin, body weight, and height were 12.2 g/dL, 21.6 Kg, and 114.8 cm, respectively; while in those with Pb levels <5 μg/dL it was 12.5 g/dL, 29 Kg and 126.55 cm, respectively (p<0.05).
Conclusion:
Nutritional status, anemia, and eating habits did not differ according to BLL; however, lower median hemoglobin, weight, and height were found in children with elevated lead levels. Children with subnormal nutritional status and children with anemia presented a shorter time to reach elevated blood lead levels.
1. INTRODUCTION
Malnutrition is a global problem. In 2022, globally, 149.2 million (22%) and 45.4 million (6.7%) children under five years of age were stunted and wasted, respectively. In South America, stunting affects 2.8 million (8.6%) children, while wasting affects 0.4 million (1.4%) children [1]. Anemia is also a global issue [2], the prevalence of anemia in children under five years is variable, with an average of 11% in high-income countries and up to 71% in poor regions [3]. In Latin America, the prevalence of anemia ranges from 23% to 33% [3]; however, Haiti and Bolivia have the highest prevalence, with 65% and 61.3% respectively [4]. In Peru, 40% of children under 3 years of age have anemia, although the prevalence can be as high as 48% in rural areas, and Andean communities [5, 6].
Anemia can have multiple causes [7], but in 50% of cases it is due to iron deficiency [2]. Anemia is greater in children with stunted growth [8], iron deficiency anemia adversely affects cognitive and motor development, and causes fatigue and low productivity [2]. Iron deficiency also predisposes children to elevated blood lead levels (BLLs) and susceptibility to its harmful effects [9, 10]. On the other hand, chronic lead poisoning is associated with poorer growth indicators in children [11], it is also worrisome for its harmful effects on multiple organs particularly in the early stages of life [12, 13]. Lead exposure continues to be an important public health problem, particularly in low and middle-income countries [14], where it often co-exists with poverty and malnutrition and contributes to the disease burden of the population [15].
In animal models, it appears that a fairly high-level of exposure to lead acetate depresses food consumption [16, 17], possibly by altering the set-point for consumption [18], and thereby affects growth in young rats [16]. It is unclear to what extent BLLs are associated with adequacy of eating habits, anemia, or malnutrition in human children with low-to-moderate lead exposure.
Malnutrition and anemia are frequent problems described at the national level and in the disadvantaged areas of Lima city and are mainly linked to deficiencies in food consumption [19]. On the other hand, in the “Mi Peru” district located in the Callao Region, there is a high proportion of children with elevated BLLs [20], a situation that may be contributing to the anemia and nutritional status of the children who live there. The objective of the present study is to investigate the links between children’s elevated BLLs, growth, anemia status, and eating habits.
2. MATERIALS AND METHODS
2.1. Study Design and Setting
The study was retrospective observational, descriptive and cross-sectional, based on a secondary source. We analyzed data from an institutional work conducted in 2018 in the district of “Mi Perú”, belonging to the Callao Region, in Lima, Peru.
2.2. Participants
The study was made up of children who attended the aforementioned health campaign carried out in 2018. According to the report of the Primary Health Care Center of “Mi Peru” district, 435 aged 6 months to 12 years participated in the health campaign.
All children who had a record of blood lead levels, hemoglobin levels, and data record of the clinical and nutritional evaluation form signed by the professionals responsible for the care were included. Of a total of 435 children evaluated, 10 were excluded because there was no record of the results of blood lead, hemoglobin, weight, height, incomplete registration, or inconsistent relevant data.
Access to data was authorized by the lead program coordinator and the chief physician at the health center.
2.3. Variables and Measurement
2.3.1. Anemia
Determination was based on hemoglobin (HB) concentration; the blood sample was taken in the morning without fasting and was obtained by the health personnel of the Mi Peru Health Center. Sample processing was carried out by personnel at the regional laboratory of the Regional Health Directorate of Callao (DIRESA Callao).
Anemia was classified based on the criteria of the technical documentation of the Ministry of Health [19]. For children aged 6 months to 5 years, Hb levels <11g/dL were considered to indicate anemia (Mild = 10.0 to 10.9; Moderate = 7.0 to 9.9 and Severe <7.0). In children 5 to 11 years of age, Hb levels <11.5 g/dL were classified as anemia (Mild = 11.0 to 11.4; Moderate = 8.0 to 10.9 and Severe <8.0). For adolescents from 12 to 14 years of age, Hb levels <12.0 g/dL were recorded as anemia (Mild = 11.0 to 11.9; Moderate = 8.0 to 10.9 and Severe <8.0).
2.3.2. Nutritional Status
It was assessed on the basis of anthropometric measures corresponding to the child's age and sex. The anthropometric measurements were taken by the nursing professionals and supported by the technical nursing staff, using the equipment and procedures recommended in the National Technical Standard [21].
For children under five years of age, we use the anthropometric nutritional assessment tables of the National Food and Nutrition Center (CENAN) based on the World Health Organization (WHO) methodology [22], which considers the Z indexes of the relationship of weight/height (W/H), height/age (H/A) and weight/age (W/A).
In the W/A relationship, normal (-2SD to ≤ 2SD), malnourished (<-2SD) and overweight (> 2SD) were considered; for H/A, normal (-2SD to 2SD), short (<-2SD), tall (> 2SD) and for W/H it was classified as normal (-2SD to 2SD), malnourished (<-2SD) and excess weight (> 2SD).
The body mass index (BMI) was considered for children aged five years and over. We use the CENAN assessment tables based on WHO methodology [23], for their classification, considering thinness (<-2SD), normal (≥-2SD to 1 SD), overweight and obesity [Excess weight (> 1SD)].
The final qualification of the nutritional status was obtained by regrouping into three categories: Normal (the aforementioned criteria were maintained), deficient (<-2SD) and excess weight (W/A, H/A or W/H> 2DE and BMI>1SD).
2.3.3. Eating Habits
The estimation was made using the 24-hour dietary recalls method and the frequency of food consumption, based on the information provided by the children’s mothers. A standardized instrument used in health establishments belonging to DIRESA Callao was used. The qualification of eating habits was based on the qualitative assessment of the nutrition professional responsible for the care. Data collection was carried out during the health campaigns and was carried out by nutrition professionals.
Based on the information collected, individual children’s diets were classified as Apparent adequate consumption of macronutrients, deficient consumption of protein and micronutrients, deficient consumption of food of animal origin, iron sources, deficient consumption of energy and protein, and high consumption of carbohydrates. For the statistical analysis, eating habits were regrouped into two categories: 1) Adequate consumption (Apparent adequate consumption of macronu-trients), 2) Inadequate consumption (poor consumption of protein and micronutrients, poor consumption of food of animal origin, iron sources, deficient energy and protein consumption, and high carbohydrate consumption).
2.3.4. Blood Lead
A non-fasting blood sample was taken by the staff of the “Mi Peru” Health Center. The test tubes with the sample obtained were transferred inside a cooler for processing by the workers of the regional laboratory, located one hour from the point of origin. The measurement was made with the LeadCare II analyzer.
Based on the Centers for Disease Control and Prevention (CDC), and the National Institute for Occupational Safety and Health (NIOSH) criteria, elevated blood lead levels were considered in children with values of ≥ 5 μg/dL [24, 25].
2.4. Data Sources
This study was conducted with data obtained from the clinical evaluation performed in a multidisciplinary health campaign during 2018 in the district of “Mi Peru”, belonging to the Callao Region, in Lima, Peru. The presence of lead in the air at levels above the standards in the monitoring points and the presence of industrial centers dedicated to metal smelting and lead recovery, have led to periodic health campaigns in Callao. The health campaigns consisted of the multidisciplinary provision of health services in the community, aimed at children and their parents.
During 2018, several campaigns were carried out aimed at schoolchildren and preschoolers living in the areas surrounding the lead source (Industries dedicated to metal smelting and lead recovery). All the activities carried out during this period were conducted with the support of the local government, health authorities and representatives of the community.
2.5. Statistical Methods
The data obtained from the clinical evaluation form was integrated into a digital format according to the study criteria. A univariate analysis was performed by calculating descriptive statistics, then represented and ordered in frequency tables. Normality tests (Kolmogorov-Smirnov test, p <0.05) were performed for hemoglobin, blood lead, weight, and height values.
The Chi-square test was used to assess the association of lead categories with nutritional status, anemia and eating habits. The evaluation of the difference in medians of these parameters according to the levels of blood lead was carried out with the Mann-Whitney U test. The strength of association was established using the Odds Ratio (OR), likewise, the adjusted OR and their 95% confidence intervals were obtained from the binary logistic regression model. The statistical power calculation was performed with G*Power version 3.1.9.7, considering a minimum expected power of 80% (1-β=0.8). Kaplan-Meier Method was used for the evaluation of the probability of development of the event (Pb≥5 μg/dL) over time. In all cases, the values of p <0.05 were considered significant and the analysis of the data was performed with the IBM SPSS version 26.
3. RESULTS
The analysis was performed with the data of 425 children, with a median age of 6 years (IQR = 5, Q3 = 9, Q1 = 4), 52.2% (n = 222) were female and 65.9% (n = 280) were five or more years old. In addition, 11.1% (n = 47) of the children had poor nutritional status, 10.1% (n = 43) had anemia, and 71.3% (n = 303) had ≥ 5 μg/dL of blood lead. Regarding eating habits, 36.9% (n = 157) of the children had high carbohydrate consumption, 36.5% (n = 155) had apparent adequate consumption of macronutrients and the rest of the children had a deficiency in consumption of some nutrients (Table 1).
Of the children with inadequate eating habits, 15.9% (n = 43) had anemia, 17.4% (n = 47) presented the deficient nutritional status and 57.8% (n = 156) had excess weight, with significant differences compared to the group of children with adequate eating habits (p<0.001).
Regarding the comparison of medians between the groups of children with Pb≥5 μg/dL and Pb<5 μg/dL levels. In the group of children with Pb≥5 μg/dL, the medians of hemoglobin [12.2 g/dL (p = 0.046; 1-β = 0.39; d = 0.19)], weight [21.6 kg (p<0.001; 1-β = 0.58; d = 0.39)], and height [114.8 cm (p<0.001; 1-β = 0.74; d = 0.41)], were significantly lower compared to the medians of the Pb<5 μg/dL group of children (12.5 g/dL, 29 kg and 126.55 cm), respectively (Table 2).
Elevated blood Pb levels were found in greater proportion among boys and children aged 5 years or older (p <0.001). The variables associated with a higher risk of presenting elevated levels of lead were male sex (ORa = 2.39, 95% CI: 1.52-3.75) and age less than 5 years (ORa = 2.46, 95% CI = 1.47 - 4.11). No statistically significant association (p>0.05) was found between blood lead levels with respect to nutritional status, hemoglobin levels, or children's eating habits (Table 3).
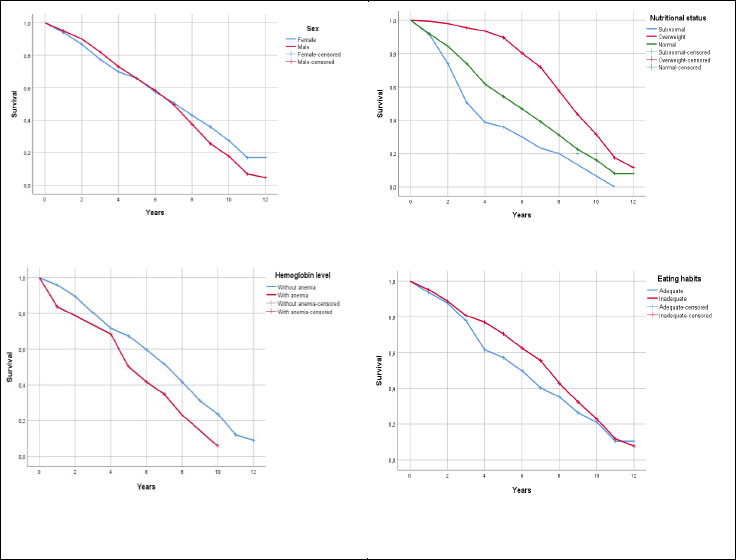
Children with subnormal nutritional status presented a median of 4 years to develop the event (Pb≥5 μg/dL), a shorter time compared to normal or overweight children (p<0.001). Children with anemia presented a median of 6 years to develop the event (p = 0.010). The variables of sex and eating habits were not significant in the development of the event (p>0.05) (Table 4). Fig. (1) shows the Kaplan-Meier curve for each of the factors: sex, nutritional status, hemoglobin level, and dietary habits.
| Variables | n | % |
|---|---|---|
| Total | 425 | 100 |
| Sex | - | |
| Female | 222 | 52.2 |
| Male | 203 | 47.8 |
| Age (years) | - | - |
| < 5 | 145 | 34.1 |
| ≥ 5 | 280 | 65.9 |
| Nutritional Status | - | - |
| Deficient | 47 | 11.1 |
| Over weight | 156 | 36.7 |
| Normal | 222 | 52.2 |
| Hemoglobin Level | - | - |
| With anemia | 43 | 10.1 |
| Without anemia | 382 | 89.9 |
| Blood Lead Level (μg/dL) | - | - |
| < 5 | 122 | 28.7 |
| ≥ 5 | 303 | 71.3 |
| Eating Habits | - | - |
| Adequate consumption of macronutrients | 155 | 36.5 |
| Protein and micronutrient deficiency | 7 | 1.6 |
| Poor consumption of FAO, iron sources | 38 | 8.9 |
| Poor energy and protein consumption | 68 | 16 |
| High carbohydrate intake | 157 | 36.9 |
| (*) FAO: Foods of animal origin |
| Variables | Pb<5 μg/dL | Pb≥5 μg/dL | p-value | 1-β | d |
|---|---|---|---|---|---|
| Median (p25-p75) | Median (p25-p50) | ||||
| Hemoglobin (g/dL) | 12.50 (11.90-13.20) | 12.20 (11.80-12.90) | 0.046 | 0.39 | 0.19 |
| Weight (Kg) | 29.00 (19.90-37.13) | 21.60 (16.00-30.80) | < 0.001 | 0.58 | 0.39 |
| Height (cm) | 126.55 (109.88-137.0) | 114.80 (98.0-129.0) | < 0.001 | 0.74 | 0.41 |
| (*) Pb= Blood lead level, p-value from the Mann-Whitney U test. | |||||
| Variables | Pb ≥ 5 μg/dL | Pb < 5 μg/dL | p-value | ORc | ORa | 95%CI | ||
|---|---|---|---|---|---|---|---|---|
| n | % | n | % | |||||
| Total | 303 | 100 | 122 | 100 | - | - | - | - |
| Sex | - | - | - | - | - | - | - | - |
| Male | 162 | 53.5 | 41 | 33.6 | < 0.001 | 2.27 | 2.39 | 1.52-3.75 |
| Female | 141 | 46.5 | 81 | 66.4 | - | - | - | - |
| Age (years) | - | - | - | - | - | - | - | - |
| < 5 | 119 | 39.3 | 26 | 21.3 | < 0.001 | 2.39 | 2.46 | 1.47-4.11 |
| ≥ 5 | 184 | 60.7 | 96 | 78.7 | - | - | - | - |
| Nutritional Condition | - | - | - | - | - | - | - | - |
| Abnormal | 136 | 44.9 | 67 | 54.9 | 0.061 | 0.67 | 0.47 | 0.21-1.04 |
| Normal | 167 | 55.1 | 55 | 45.1 | - | - | - | - |
| Hemoglobin Level | - | - | - | - | - | - | - | - |
| With anemia | 30 | 9.9 | 13 | 10.7 | 0.815 | 0.92 | 0.67 | 0.29-1.54 |
| Without anemia | 273 | 90.1 | 109 | 89.3 | - | - | - | - |
| Eating Habits | - | - | - | - | - | - | - | - |
| Inadequate | 191 | 63.0 | 79 | 64.8 | 0.739 | 0.93 | 1.98 | 0.85-4.61 |
| Adequate | 112 | 37.0 | 43 | 35.2 | - | - | - | - |
| (*) Pb= Blood lead level, ORc= crude odds ratio, ORa=adjusted odds ratio, 95%IC=95% confidence interval. | ||||||||
| Factors | Median | 95% Confidence Interval | Log Rank (Mantel-Cox) | ||
|---|---|---|---|---|---|
| Estimate | Lower Bound | Upper Bound | Chi-Square | p-value | |
| Sex | - | - | - | - | - |
| Female | 8.00 | 7.01 | 8.99 | 2.162 | 0.141 |
| Male | 7.00 | 6.32 | 7.68 | - | - |
| Global | 8.00 | 7.43 | 8.57 | - | - |
| Nutritional Status | - | - | - | - | - |
| Normal | 6.00 | 5.09 | 6.91 | 46.935 | <0.001 |
| Overweight | 9.00 | 8.39 | 9.61 | - | - |
| Subnormal | 4.00 | 3.17 | 4.83 | - | - |
| Global | 8.00 | 7.43 | 8.57 | - | - |
| Hemoglobin Level | - | - | - | - | - |
| Without anemia | 8.00 | 7.41 | 8.59 | 6.714 | 0.010 |
| With anemia | 6.00 | 4.83 | 7.17 | - | - |
| Global | 8.00 | 7.43 | 8.57 | - | - |
| Eating Habits | - | - | - | - | - |
| Adequate | 6.00 | 5.04 | 6.96 | 3.281 | 0.070 |
| Inadequate | 8.00 | 7.50 | 8.50 | - | - |
| Global | 8.00 | 7.43 | 8.57 | - | - |
4. DISCUSSION
In the present study, one in 10 children with elevated blood lead levels had poor nutritional status, one had anemia and six had inadequate eating habits. Anemia is a problem in the 25 regions of Peru; 10.2% (95% CI: 9.5-10.9) of infants aged two to five months attending health facilities of the Ministry of Health have anemia [26], and in the urban-marginal areas of North Lima, anemia in children is also frequent [27, 28]. The results of the present study show that, among children with elevated blood lead levels, only one-tenth had anemia and the frequency remained similar for both children with low and high Pb levels, suggesting that Pb would not be directly responsible for the presence of anemia.
In addition, anemia in Peruvian children is due to poor intake of foods rich in iron and other micronutrients from 6 months, especially of heme iron derived from animal foods, the deficit in consumption of iron-rich foods among children from 6 to 18 months, reduced breastfeeding, low adherence to iron supplementation, low birth weight, diarrheal infections and parasitic disease, poor basic sanitation, and inadequate hygiene practices; and limited access to comprehensive health care services [19]. It is known that both Pb and iron use the same transporter in the small intestine, and the absorption of Pb increases in children with iron deficiency [29]. In children with Pb levels ≥10 μg/dL there is an increased risk of anemia and decreased iron absorption both of which negatively affect hematological parameters [30].
In this study, the medians of hemoglobin levels, weight and height in children with Pb ≥ 5 μg/dL were lower than those with Pb <5 μg/dL and this difference was significant, although the effect size was small. Studies have not established a clear association between elevated blood Pb levels and growth retardation, (OR: 1.37 (95% CI: 0.87–2.15); p> 0.05), acute malnutrition (OR: 1.37 (95% CI: 0.87–2.15); p> 0.05) and being underweight (OR: 1.44 (95% CI: 0.94–2.21); p> 0.05); however, based on multiple logistic regression models, high levels of Pb are associated with growth retardation and low body weight (p<0.05), but not for acute malnutrition (p>0.05) [11].
In Bangladesh, a positive association was reported between blood Pb levels in 20 and 40 months of age and stunting in these age groups (OR=1.12; 95%CI: 1.02-1.22); children who had a blood Pb level greater than the third quartile of exposure at 20 to 40 months (7.6 μg/dL) were 2.6 times (95% CI: 1.4 – 5.0) more likely to be stunted than children with a blood Pb level below the first quartile of exposure (1.7 μg/dL) [31].
In indigenous children and adolescents in the Peruvian Amazon exposed to Pb, the likelihood of stunting was twice as high in the group whose blood Pb levels were> 5 µg/dL (p <0.05), than in adolescents with lower Pb levels [32]. Children with detectable Pb levels (≥1 µg / dL) had a statistically significantly lower mean body mass index (BMI) (p = 0.009), a BMI Z score (p = 0.012), and a BMI percentile (p = 0.009) compared to children with undetectable Pb levels [33].
An important finding of this study was that children under 5 years of age (ORa = 2.46; 95% CI 1.47 to 4.11) and boys (ORa = 2.39; 95% CI 1.52 to 3.75) were at increased risk of elevated blood lead levels. In addition, children with subnormal nutritional status and children with anemia presented a shorter time to reach elevated blood lead levels (Pb≥5 μg/dL).
The behavior of young children to put everything in their mouths, and the qualitative and quantitative characteristics of routine activities according to sex, may explain the increased risk of elevated blood lead levels. These are consistent with studies indicating the existence of gender-related differences in playing behaviors [34], additionally, children's habits such as hand-mouth behavior and pica are predictors of elevated blood lead levels in children [35]. Likewise, in a previous study, a significant risk for elevated blood lead levels in children was observed for residences with a dirty floor (OR: 2.92; 95% CI: 1.26 - 6.78), children's soil ingestion habit (OR: 1.76; 95% CI: 1.02 - 3.07), pencil biting or sucking (OR: 1.86; 95% CI: 1.12 - 3.10), and toy biting or sucking (OR: 1.97; 95% CI: 1.16 - 3.33) [20].
On the other hand, in the present study it is also worth noting that in children with inadequate eating habits, 17% had poor nutritional status and 16% had anemia; although this finding was statistically significant, the observed frequencies were small in the categories of eating habits. However, the results presented are consistent with the statement that malnutrition and anemia, which are frequent problems at the national level and in the marginal urban areas of Lima and Callao, are linked to food consumption [19]. Studies indicate that increased consumption of calcium-rich foods, dairy, and yogurt is associated with low concentrations of Pb in the blood and urine, while iron deficiency is associated with higher concentrations of Pb in the blood; however, the increased consumption of foods rich in iron or vitamin C is not related to the levels of Pb in urine or blood [36].
Among the weaknesses of the study, the data were not collected for the exclusive purpose of the present study, and therefore, several key variables are missing. Likewise, in the present study, lead was considered Pb≥5 μg/dL as elevated levels; however this does not meanthat lower figures are considered normal. Taking into account data since May 2021, CDC uses a blood lead reference value of 3.5 µg/dL to identify children with blood lead levels that are higher than most children’s levels [24].
On the other hand, nutritional status was assessed based on anthropometric measures according to age and sex, and with its determination, different health personnel participated in each health campaign, and failure to meet the criteria unit could influence the precision of the measures and consequently in the classification of nutritional status. For eating habits, the 24-hour reminder method and the frequency of food consumption were used, which is also not the total reflection of eating habits, on the other hand, not all children were with their mothers; some were with their fathers or relatives. Likewise, the instrument used to assess eating habits is for regional institutional use and has not been subjected to validity and reliability studies. Despite these limitations, the study has important information that can be taken into account in healthcare, preventive and promotional health interventions.
CONCLUSION
Nutritional status, anemia and eating habits did not reveal significant differences according to blood lead levels; however, the median hemoglobin level, weight, and height were lower in children with elevated lead levels. In addition, children with subnormal nutritional status and children with anemia presented a shorter time to reach elevated blood lead levels. On the other hand, eating habits were related to nutritional status and anemia. It is suggested to maintain the necessary sanitary measures to reduce lead exposure and reinforce the promotion of healthy eating habits to contribute to the reduction of anemia and poor nutritional status in children.
LIST OF ABBREVIATIONS
| BLLs | = Blood Lead Levels |
| HB | = Hemoglobin |
| WHO | = World Health Organization |
| W/A | = Weight/Age |
| BMI | = Body Mass Index |
| NIOSH | = National Institute for Occupational Safety and Health |
| CDC | = Centers for Disease Control and Prevention |
| OR | = Odds Ratio |
| DIRESA Callao | = Regional Health Directorate of Callao |
| CENAN | = National Food and Nutrition Center |
ETHICS APPROVAL AND CONSENT TO PARTICIPATE
The project was evaluated and approved by the Ethics Committee of the University of Sciences and Humanities, Lima, Peru (CEI Act No. 006-2019).
HUMAN AND ANIMAL RIGHTS
No animals were used in this research. All procedures performed in studies involving human participants were in accordance with the ethical standards of institutional and/or research committee and with the 1975 Declaration of Helsinki, as revised in 2013.
CONSENT FOR PUBLICATION
Informed consent was obtained from all participants.
STANDARDS OF REPORTING
STROBE guidelines were followed in this study.
AVAILABILITY OF DATA AND MATERIALS
The data that support the findings of this study are available from the corresponding author [J.M.] on special request.
FUNDING
None.
CONFLICT OF INTEREST
The authors declare no conflict of interest financial or otherwise.
ACKNOWLEDGEMENTS
Declared none.

