All published articles of this journal are available on ScienceDirect.

Determinants of High Marital Fertility in Malawi: Evidence from 2010 and 2015-16 Malawi Demographic and Health Surveys
Abstract
Background:
Although the Total Fertility Rate (TFR) has declined from 5.7 in 2010 to 4.6 during 2015-16, fertility in Malawi remains high. The high fertility is responsible for the rapid population growth, which negatively impacts the social and economic development of the country. Available data show that nearly 90% of all births in the country occur among married women.
Objective:
The main objective of the study is to investigate the determinants of fertility among married women (marital fertility) in Malawi.
Methods:
This study used data extracted from the 2010 and 2015-16 Malawi demographic and health surveys. Bivariate and multivariate analyses were performed to examine the factors associated with fertility among married women.
Results:
The mean number of children born declined from 3.80 in 2010 to 3.44 in 2015. The background characteristics of the women were found to be accounted for the variation. Poisson regression analysis revealed that the age of respondent, place of residence, contraceptive use, age at first sex, age at marriage, age at birth, marriage duration, wanted last birth, ideal number of children, death of child and education were all factors significantly related to fertility.
Conclusion:
These significant factors should be the focus of programs that aim to further reduce fertility in Malawi.
1. INTRODUCTION
Compared to neighbouring countries, Malawi always has a high rate of fertility. In a traditional Malawian society, children are a sign of status and wealth [1], and children are seen as a source of cheap labour and old age security [1, 2]. In most cases, childbearing takes place within the institution of marriage. In Malawi, marriage can be described as early and universal [3, 4]. It is regarded as a disgrace for a grown-up man or woman to be single and childless. These views on marriage and childbearing are reinforced by the strong kinship networks and prevailing high economic and social values of children in most African cultures [5].
By 2010, almost all parts of the world experienced a fertility decline [6, 7]. With the exception of South Africa, reports on the decline in fertility rate in sub-Saharan Africa first emerged in the 1990s [8]. The Total Fertility Rate (TFR) in Malawi increased from 6.5 in the 1960s to 7.6 in the 1970s and declined to 7.4 in 1987 [9-12]. Subsequent population censuses indicated a further decline to 6.5 in 1998, 5.2 in 2008, and 4.2 in 2018 [13-15]. Data from Demographic and Health Surveys (DHS) indicated a decline from 6.7 in 1992 to 6.4 in 2000, 6.0 in 2004, 5.7 in 2010, and 4.6 in 2015-16 [16-20]. These estimates suggested that fertility declined by 4.5% between 1992 and 2000, 6.3% between 2000 and 2004, 5.0% between 2004 and 2010, and 22.8% between 2010 and 2015-16. This is not a small achievement considering that the Malawi Government (MG) officially embarked on fertility reduction targets in 1994 with the adoption of both population policy and family planning (FP) [21].
The high level of fertility and slow-declining TFR, together with a reduction in mortality rate, leads to rapid population growth [22, 23]. A number of studies in developing countries have indicated that rapid population growth is one of the factors attributing to social, economic and demographic challenges experienced in these countries [23]. These negative consequences of rapid population growth led several countries to develop population policies aimed at bringing population growth in line with social and economic development.
The first national population policy for Malawi was developed in the early 1990s and approved in 1994 for the period 1994-2002 with the aim of reducing population growth to manageable levels [21]. This policy was revised in the early 2000s [24]. The main objective of the population policies [21, 24] is “to have manageable population growth, structure, and distribution that are commensurate with the country’s resources for sustainable development”. This objective is in line with Malawi’s Vision 2020 [22], which states that “the strategic challenge to population growth is reducing the rate of population growth (reducing the TFR as well as the high mortality rate), and raising the literacy and economic status of women”. The status of social and economic indicators in Malawi remains poor even though the levels are improving. For instance, in 2014, Malawi ranked 174 out of 188 countries with the Human Development Index of 0.445 [25]. However, despite this poor indicator of social and economic status, the TFR in Malawi still decreased by about 22.8% between 2010 and 2015-16 [19, 20].
Understanding the nature and patterns of fertility in different areas has been one of the recurring areas of demographic research [2, 26-28]. The high prevalence of contraceptive use, persistent high TFR, and slow decline in fertility have been a source of concern among researchers and policymakers [27]. This study aims to explore the determinants of fertility, specifically among married women in Malawi, during a period of a significant decrease in TFR.
2. METHODS
2.1. Sources of Data
The data for this study was extracted from the 2010 and 2015-16 Malawi Demographic and Health Surveys (MDHSs) [19, 20]. The MDHSs are cross-sectional, nationally representative surveys conducted by the National Statistical Office (NSO) with the technical assistance provided by ORC Macro through the MEASURE DHS program. The surveys used a two-stage cluster sampling procedure to collect demographic information from women from all the administrative regions of the country. The sampling frame for both surveys was the 2008 Malawi population census, with the enumeration areas (EAs) as the sampling units for the first stage.
The 2010 MDHS selected 158 EAs in urban areas and 691 EAs in rural areas at the first stage of the survey. The second stage involved the listing of households in all the selected clusters and a selection of at least 950 households in each district.
In the 2015-16 MDHS, the first stage involved selecting 173 EAs in urban areas and 677 EAs in rural areas, with probability proportional to the EA’s size. The second stage of selection involved selecting 30 households per urban cluster and 33 households per rural cluster. Detailed information about the surveys can be obtained from the MDHS reports [19, 20].
The study population consisted of 15528 and 16130 currently married women in 2010 and 2015-16, respectively. The focus on married women was based on the observation that most of the childbearing in Malawi occurs within marriage. Both the 2010 and 2015-16 MDHS reports indicate that nearly 90% of all births in the country occur among married women.
2.2. Description of Variables
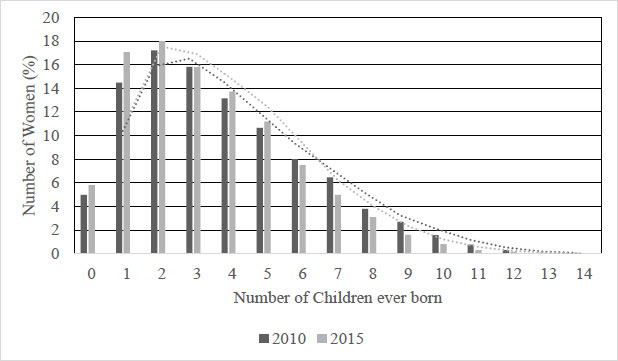
The outcome variable used in this paper is marital fertility, which is defined as the number of children ever born (CEB) by married women. The mean CEB (also known as mean parities) is used as an indicator of fertility in various studies and represents lifetime fertility up to the survey date [29-31]. CEB was taken as a count variable, which compelled the use of Poisson regression (Fig. 1).
The independent variables included the age of the respondents, age at first sex, age at first marriage, age at birth of the first child, region, place of residence, education, work status, wealth status, ethnicity, religion, the ideal number of children, wanted last-child, current use of FP methods, sex of head of household (HH), and the death of a child experienced by mothers. These variables were included in the analysis because of their observed relationship with children ever born and their significance in previous fertility studies [28, 32-36].
Some of the independent variables used by the MDHS were recategorized to simplify analysis and interpretation for the purpose of the current study. Respondents were grouped into the five-year age groups: 15-19, 20-24, 25-29, 30-34, 35-39, 40-44, and 45-49. Malawi has three administrative regions: Northern Region, Central Region and Southern Region. The type of place of residence was rural or urban, whereas work status was categorized as not working or working. In MDHS, wealth status was indicated as poorest, poorer, middle, richer and richest. In this study, the first two categories and the last two categories were regrouped to indicate the status of the poor and rich, respectively. Age at first sex, age at birth of first child and age at marriage were continuous variables that were regrouped into two categories as follows: those that had the first sex before 18 years and those older than 18 years. The highest level of education of respondents was recoded into three categories as no education, primary and secondary, and higher education. The variable for an ideal number of children was categorized into two categories, namely, up to four children and five or more children. Wanted last birth was a variable categorized as wanted or wanted no more. The use of FP was categorized into non-use and current use. The gender of the HH was classified as either male or female. Lastly, the number of children dead was only coded as no dead child in households where no child deaths were reported.
2.3. Methods of Analysis
The study involved three approaches. Firstly, the frequency distributions of all the variables were examined. Secondly, the associations of the dependent and independent variables were carried out using a one-way Analysis of Variance (ANOVA) and F-test. Thirdly, the correlates of fertility were determined using the Poisson multivariate analysis. Studies have shown that the Poisson model is better to use in the case of a count variable than the ordinary least squares (OLS) model or other linear models [36-40]. The Poisson regression model is as follows:

Where CEB is the number of children ever born to a woman, a is a constant, bis are coefficients of the explanatory variables, Xi is the independent variables, and e is the error term. The IBM Statistical Package for the Social Sciences (SPSS) version 27 was used to analyse the data.
2.4. Ethical Consideration
Permission to use the 2010 and 2015-16 MDHS datasets was obtained from the Measure DHS website, where registration was required. Both national and international standards for biomedical research involving human subjects were adhered to as the survey protocols were ratified by the National Health Sciences Research Committee in Malawi and the ICF Institutional Review Board [19, 20].
3. RESULTS
3.1. Characteristics of the Study Population
The characteristics of the study population are summarized in Table 1. With respect to the age of the respondents, Table 1 indicates that in 2015, 30.3% were between ages 15-24 years, 19.9% were between 25-29 years of age, 18.5% of them were between 30-34 years of age, while 14.4% of respondents were between ages 35-39, 9.6% were aged between 40-44 years, and 7.2% were between 45-49 years. Overall, nearly half of the study population was below 30 years of age. The mean age of the population was 30.5 and 30.8 years in 2010 and 2015, respectively.
In 2015, 44.4% of the women were from the southern region, followed by 43.2% from the central region and 12.4% from the northern region. Most of the respondents resided in rural areas (83.8% in 2015) and were working (67.3% in 2015). The study population in 2015 comprised 64.3% of women with primary education, 21.5% of women with secondary and higher education, and 14.2% of women with no education. The results in Table 1 reveal that in 2015, 40.6% of the study population were rich, 19.8% belonged to the middle-income category, and 39.6% were poor. Most of the study populations resided in male HH (84.7% in 2015). In addition, Table 1 reveals that in 2015, 50.8% of the respondents had their first sex before the age of 18 years, 65.1% got married before 19 years old, and 81.5% had their first child before they were 18 years of age. These statistics reveal that sex, marriages and childbearing occur at an early age in Malawi. Most women interviewed indicated four children or less as ideal, and 88.4% indicated that their last child was wanted. Nearly six out of 10 of the study population used FP, and only 23.5% had experienced the death of a child.
3.2. Association of Children Ever Born and Background Variables
Table 2 shows the mean parities by selected demographic and socioeconomic characteristics. Table 2 reveals that background variables are associated with the mean number of children ever born. The mean number of children ever born was higher among older women, women residing in rural areas, women with little education, poor women, working women, women who marry early, women who give birth early, women in polygamous marriages, and women who want no more children. In addition, women currently using FP methods had more CEB than those not currently using FP methods. The mean number of CEB was high among women in male HHs, women currently using contraceptives, women who wanted no more children, and women whose ideal number of children was greater than five.
| Variables | 2010 | 2015 | ||
|---|---|---|---|---|
| Age of respondent (years) | N | % | N | % |
| 15-19 | 1171 | 7.5 | 1235 | 7.7 |
| 20-24 | 3469 | 22.3 | 3653 | 22.6 |
| 25-29 | 3718 | 23.9 | 3216 | 19.9 |
| 30-34 | 2636 | 17.0 | 2990 | 18.5 |
| 35-39 | 2040 | 13.1 | 2321 | 14.4 |
| 40-44 | 1339 | 8.6 | 1556 | 9.6 |
| 45-49 | 1155 | 7.4 | 1160 | 7.2 |
| Total | 15528 | 100.0 | 16130 | 100.0 |
| Region | - | - | - | - |
| Northern region | 1871 | 12.0 | 1999 | 12.4 |
| Central region | 6678 | 43.0 | 6966 | 43.2 |
| Southern region | 6979 | 44.9 | 7165 | 44.4 |
| Total | 15528 | 100.0 | 16130 | 100.0 |
| Place of residence | - | - | - | - |
| Urban | 2686 | 17.3 | 2612 | 16.2 |
| Rural | 12841 | 82.7 | 13518 | 83.8 |
| Total | 15528 | 100.0 | 16130 | 100.0 |
| Work status | - | - | - | - |
| Not Working | 6484 | 41.8 | 5273 | 32.7 |
| Working | 9027 | 58.2 | 10857 | 67.3 |
| Total | 15511 | 100.0 | 16130 | 100.0 |
| Wealth status | - | - | - | - |
| Poor | 5759 | 37.1 | 6383 | 39.6 |
| Middle | 3303 | 21.3 | 3191 | 19.8 |
| Rich | 6465 | 41.6 | 6557 | 40.6 |
| Total | 15528 | 100.0 | 16130 | 100.0 |
| Type of marriage | - | - | - | - |
| Monogamy | 13180 | 85.5 | 14065 | 87.2 |
| Polygamy | 2227 | 14.5 | 2065 | 12.8 |
| Total | 15407 | 100.0 | 16130 | 100.0 |
| Age at birth of the first child (years) | - | - | - | - |
| <=18 | 11023 | 71.0 | 8199 | 54.0 |
| >18 | 4504 | 29.0 | 6994 | 46.0 |
| Total | 15528 | 100.0 | 15193 | 100.0 |
| Age at marriage (years) | - | - | - | - |
| <=18 | 11914 | 81.8 | 10503 | 65.1 |
| >18 | 2657 | 18.2 | 5627 | 34.9 |
| Total | 14571 | 100.0 | 16130 | 100.0 |
| Age at first sex (years) | - | - | - | - |
| <=18 | 8253 | 53.1 | 13144 | 81.5 |
| >18 | 6502 | 41.9 | 2984 | 18.5 |
| Total | 14755 | 95.0 | 16128 | 100.0 |
| Education | - | - | - | - |
| None | 2826 | 18.2 | 2291 | 14.2 |
| Primary | 10231 | 65.9 | 10368 | 64.3 |
| Secondary+ | 2470 | 15.9 | 3472 | 21.5 |
| Total | 15528 | 100.0 | 16130 | 100.0 |
| Ideal no. of children | - | - | - | - |
| <=4 | 10311 | 68.0 | 12239 | 76.9 |
| >4 | 4862 | 32.0 | 3679 | 23.1 |
| Total | 15173 | 100.0 | 15918 | 100.0 |
| Wanted last birth | - | - | - | - |
| Wanted | 8548 | 73.2 | 9879 | 88.4 |
| Wanted no more | 3133 | 26.8 | 1302 | 11.6 |
| Total | 11681 | 100.0 | 11180 | 100.0 |
| Use of FP | - | - | - | - |
| Non-use | 8368 | 56.1 | 6578 | 40.8 |
| Current use | 6558 | 43.9 | 9552 | 59.2 |
| Total | 14926 | 100.0 | 16130 | 100.0 |
| No. of children dead | - | - | - | - |
| No dead child | 9896 | 63.7 | 12340 | 76.5 |
| At least one dead child | 5632 | 36.3 | 3790 | 23.5 |
| Total | 15528 | 100.0 | 16130 | 100.0 |
| Sex of HH | - | - | - | - |
| Male | 13456 | 88.7 | 13658 | 84.7 |
| Female | 2072 | 13.7 | 2472 | 15.3 |
| Total | 15528 | 100.0 | 16130 | 100.0 |
| Variable | 2010 | 2015 | ||||||
|---|---|---|---|---|---|---|---|---|
| F | 45-49 | F | F | 45-49 | F | |||
| Age of respondent (years) | All | 3546.5*** | - | - | All | 3677.6*** | - | - |
| 15-19 | 0.73 | - | - | - | 0.68 | - | - | - |
| 20-24 | 1.84 | - | - | - | 1.55 | - | - | - |
| 25-29 | 3.09 | - | - | - | 2.77 | - | - | - |
| 30-34 | 4.37 | - | - | - | 3.96 | - | - | - |
| 35-39 | 5.70 | - | - | - | 4.99 | - | - | - |
| 40-44 | 6.48 | - | - | - | 5.89 | - | - | - |
| 45-49 | 7.26 | - | 7.26 | - | 6.41 | - | 6.41 | - |
| Region | - | 35.9*** | - | 11.348*** | - | 0.3 | - | 3.648* |
| Northern region | 3.75 | - | 7.28 | - | 3.40 | - | 6.40 | - |
| Central region | 3.99 | - | 7.63 | - | 3.44 | - | 6.63 | - |
| Southern region | 3.62 | - | 6.82 | - | 3.44 | - | 6.19 | - |
| Place of residence | - | 190.3*** | - | 21.905*** | - | 284.1*** | - | 42.938*** |
| Urban | 3.18 | - | 6.42 | - | 2.75 | - | 5.08 | - |
| Rural | 3.92 | - | 7.43 | - | 3.57 | - | 6.59 | - |
| Work Status | - | 190.8** | - | 0.005 | - | 156.7*** | - | 0.956 |
| Not working | 3.47 | - | 7.07 | - | 3.11 | 156.7*** | 6.53 | - |
| Working | 4.03 | - | 7.36 | - | 3.60 | - | 6.36 | - |
| Wealth Status | - | 96.2*** | - | 21.131*** | - | 36.0*** | - | 14.168*** |
| Poor | 4.00 | - | 7.83 | - | 3.37 | - | 6.59 | - |
| Middle | 3.86 | - | 7.18 | - | 3.75 | - | 7.00 | - |
| Rich | 3.58 | - | - | - | 3.35 | - | - | - |
| Duration of Marriage (years) | - | 4672.2*** | - | 10.820*** | - | 4469.8*** | - | 15.650*** |
| 0-4 | 1.12 | - | 9.00 | - | 1.07 | - | 4.81 | - |
| 5-9 | 2.52 | - | 6.46 | - | 2.34 | - | 5.85 | - |
| 10-14 | 3.88 | - | 4.15 | - | 3.64 | - | 5.17 | - |
| 15-19 | 5.26 | - | 4.64 | - | 4.67 | - | 5.23 | - |
| 20-24 | 6.42 | - | 6.31 | - | 5.67 | - | 5.19 | - |
| 25-29 | 7.01 | - | 7.25 | - | 6.32 | - | 6.34 | - |
| 30+ | 7.53 | - | 7.66 | - | 7.14 | - | 6.41 | - |
| Age at first sex (years) | - | 41.8*** | - | 2.153 | - | 242.8*** | - | 22.036*** |
| <=18 | 3.98 | - | 7.55 | - | 3.57 | - | 6.58 | - |
| >18 | 3.36 | - | 6.69 | - | 2.85 | - | 5.68 | - |
| Age at marriage (years) | - | 192.9*** | - | 28.160*** | - | 266.5*** | - | 80.196*** |
| <=18 | 3.84 | - | 7.04 | - | 3.65 | - | 6.98 | - |
| >18 | 3.31 | - | 6.88 | - | 3.03 | - | 5.64 | - |
| Age at birth of the first child (years) | - | 205.3*** | - | 19.040*** | - | 215.0*** | - | 99.528*** |
| <=18 | 4.25 | - | 7.71 | - | 3.89 | - | 7.26 | - |
| >18 | 3.67 | - | 6.98 | - | 3.37 | - | 5.82 | - |
| Education | - | 1174.4*** | - | 22.108*** | - | 1121.3*** | - | 38.685*** |
| None | 5.41 | - | 7.64 | - | 5.00 | - | 6.78 | - |
| Primary | 3.72 | - | 7.15 | - | 3.49 | - | 6.49 | - |
| Secondary and over | 2.27 | - | 4.75 | - | 2.25 | - | 4.33 | - |
| Ideal no. children | - | 3209.9*** | - | 6.467*** | - | 3633.1*** | - | 110.315*** |
| <=4 | 3.02 | - | 6.95 | - | 2.87 | - | 5.50 | - |
| >4 | 5.27 | - | 7.47 | - | 5.21 | - | 7.06 | - |
| Wanted the last child | - | 929.8*** | - | 26.075*** | - | 2165.4*** | - | 1.256 |
| Wanted | 3.39 | - | 8.01 | - | 3.03 | - | 7.60 | - |
| Wanted no more | 4.82 | - | 9.23 | - | 5.68 | - | 7.94 | - |
| Use of FP | - | 355.5*** | - | 30.247*** | - | 364.4*** | - | 29.822*** |
| Non-use | 3.44 | - | 6.88 | - | 3.02 | - | 5.98 | - |
| Current use | 4.19 | - | 7.77 | - | 3.72 | - | 6.81 | - |
| Sex of HH | - | 39.9*** | - | 1.902 | - | 21.874*** | - | 3.804* |
| Male | 3.85 | - | 7.31 | - | 3.47 | - | 6.47 | - |
| Female | 3.47 | - | 6.96 | - | 3.24 | - | 6.04 | - |
| No. children dead | - | 6156.4*** | - | 257.397*** | - | 5055.5*** | - | 250.492*** |
| No dead | 2.77 | - | 5.56 | - | 2.81 | - | 5.16 | - |
| Children dead | 5.59 | - | 7.94 | - | 5.48 | - | 7.38 | - |
| Variables | 2010 | 2015 | ||||
|---|---|---|---|---|---|---|
| 95% CI | 95% CI | |||||
| IRR | LB | UB | IRR | LB | UB | |
| Age of Respondent (years) | - | - | - | - | - | - |
| 15-19 | 0.37*** | 0.32 | 0.44 | 0.34*** | 0.30 | 0.39 |
| 20-24 | 0.53*** | 0.47 | 0.60 | 0.49*** | 0.44 | 0.54 |
| 25-29 | 0.67*** | 0.60 | 0.75 | 0.66*** | 0.60 | 0.72 |
| 30-34 | 0.79*** | 0.71 | 0.87 | 0.80 | 0.73 | 0.86 |
| 35-39 | 0.85*** | 0.78 | 0.94 | 0.91 | 0.84 | 0.98 |
| 40-44 | 0.92* | 0.85 | 1.00 | 1.00*** | 0.93 | 1.07 |
| 45-49 (R) | - | - | - | - | - | - |
| Region | - | - | - | - | - | - |
| Northern region | 1.00 | 0.93 | 1.07 | 1.00*** | 0.95 | 1.06 |
| Central region | 1.02 | 0.98 | 1.05 | 0.99* | 0.96 | 1.03 |
| Southern region (R) | - | - | - | - | - | - |
| Place of Residence | - | - | - | - | - | - |
| Urban | 0.95* | 0.91 | 0.99 | 0.92*** | 0.88 | 0.9 |
| Rural (R) | - | - | - | - | - | - |
| Work Status | - | - | - | - | - | - |
| Not Working | 1.02 | 0.99 | 1.05 | 1.00 | 0.98 | 1.02 |
| Working (R) | - | - | - | - | - | - |
| Wealth Status | - | - | - | - | - | - |
| Poor | 1.01 | 0.97 | 1.06 | 1.03* | 1.00 | 1.06 |
| Middle | 1.01 | 0.97 | 1.05 | 1.02 | 0.99 | 1.06 |
| Rich (R) | - | - | - | - | - | - |
| Age at birth of a first child (years) | - | - | - | - | - | - |
| <=18 | 1.18*** | 1.14 | 1.22 | 1.17*** | 1.14 | 1.21 |
| >18 (R) | - | - | - | - | - | - |
| Age at marriage (years) | - | - | - | - | - | - |
| <=18 | 0.96* | 0.92 | 1.00 | 0.97* | 0.93 | 1.00 |
| >18 (R) | - | - | - | - | - | - |
| Age at first sex (years) | - | - | - | - | - | - |
| <=18 | 1.02 | 0.98 | 1.07 | 1.06*** | 1.02 | 1.10 |
| >18 (R) | - | - | - | - | - | - |
| Education | - | - | - | - | - | - |
| None | 1.12*** | 1.06 | 1.19 | 1.15*** | 1.10 | 1.20 |
| Primary | 1.12*** | 1.07 | 1.17 | 1.11*** | 1.07 | 1.15 |
| Secondary+ (R) | - | - | - | - | - | - |
| Ideal no. of children | - | - | - | - | - | - |
| <=4 | 0.89*** | 0.87 | 0.90 | 0.90*** | 0.88 | 0.92 |
| >4 (R) | - | - | - | - | - | - |
| Wanted last birth | - | - | - | - | - | - |
| Wanted | 0.90*** | 0.87 | 0.92 | 0.90*** | 0.88 | 0.93 |
| Wanted no more (R) | - | - | - | - | - | - |
| Use of FP | - | - | - | - | - | - |
| Non-use | 0.96*** | 0.93 | 0.98 | 0.98* | 0.95 | 1.00 |
| Current use (R) | - | - | - | - | - | - |
| No. children dead | - | - | - | - | - | - |
| No Dead | 0.83*** | 0.81 | 0.86 | 0.83*** | 0.81 | 0.85 |
| Dead (R) | - | - | - | - | - | - |
| Sex of HH | - | - | - | - | - | - |
| Male | 1.03 | 0.99 | 1.07 | 1.06*** | 1.03 | 1.09 |
| Female (R) | - | - | - | - | - | - |
| Marital duration (years) | - | - | - | - | - | - |
| 0-4 | 0.41*** | 0.35 | 0.49 | 0.42*** | 0.36 | 0.48 |
| 5-9 | 0.62*** | 0.53 | 0.71 | 0.58*** | 0.51 | 0.66 |
| 10-14 | 0.75*** | 0.65 | 0.85 | 0.71*** | 0.63 | 0.79 |
| 15-19 | 0.86* | 0.76 | 0.98 | 0.77*** | 0.69 | 0.86 |
| 20-24 | 0.93 | 0.83 | 1.05 | 0.82*** | 0.74 | 0.91 |
| 25-29 | 1.02 | 0.91 | 1.15 | 0.88* | 0.79 | 0.97 |
| 30+ (R) | - | - | - | - | - | - |
3.3. Multivariate Analysis
The results of multivariate analyses are presented in Table 3. The variables that are significantly related to marital fertility in Malawi include the age of respondent, place of residence, current use of contraceptives, age at first sex, age at first marriage, age at birth of the first child, duration of married/cohabitation, wanted last birth, the ideal number of children, death of child, education, and wealth status.
Table 3 indicates that marital fertility is significantly associated with the age of the woman. The likelihood for decreased fertility was 66%, 51%, 34%, 20%, and 9% among married women in the age groups of 15-19, 20-24, 25-29, 30-34, 35-39, and 40-44, respectively. The relative risk of having children decreases with increasing age, suggesting an increase in the number of children as the age of the women increases.
Fertility among married women was found to be associated with the type of residence. There was an 8% decrease in children born among married women residing in urban areas compared to married women residing in rural areas.
The number of children ever born among currently married women varies with age at first sex, age at marriage and age at first birth. There was a 6% increase in the number of children ever born among married women who started sex before the age of 18 years as compared to married women who started sex after the age of 18 years. The risk of fertility was reported to be decreased by 3% if women married before the age of 18 years compared to marriage after the age of 18 years. Married women who had their first child before 18 years have a 17% increase in the risk of bearing children compared to their counterparts who marry after the age of 18 years.
Marital fertility was found to be significantly related to the education level of women. There was a 15% and 11% increase in the number of children ever born to married women with no education and primary education.
Fertility preferences are significantly associated with marital fertility. Married women whose ideal number of children is four or less have a 10% decrease in the number of children ever born compared to women whose ideal number of children is four and above. In addition, women whose last birth was wanted had a 10% reduced risk of bearing children compared to women whose last birth was not wanted.
Use or non-use of FP also affect the number of children ever born. Women who do not use FP have a 2% reduced risk of bearing children compared to women who use FP.
Another factor that is significantly related to the number of children even born is child mortality. Women who had not lost any child had a 17% decrease in the number of children ever born compared to women who had lost a child. Women residing in households headed by a male had a 2% increase in the number of children ever born compared to women who reside in male HHs.
The number of children ever born among married women is also influenced by the duration of the marriage. Women whose marital duration was 0-4 years had a 58% reduced risk of bearing children compared to women who have been married for 30 years or more. Similar percentages for marital duration 5-9, 10-14, 15-19, 20-24, and 25-29 were 42%, 29%, 23%, 18%, and 12%, respectively. The risk of marital fertility decreases as the duration of marriage increases.
4. DISCUSSION
The study found that currently married Malawian women of reproductive age had a mean number of children ever born of 3.74 in 2010 and 3.44 in 2015. The mean number of children born among women aged 45-49 years was 7.42 and 6.41 in 2010 and 2015, respectively. Two aspects are important about the values of a mean number of children ever born. Firstly, the level of lifetime fertility is still high. Secondly, there is some evidence of a decline in the TFR. The continued high fertility suggests the need to strengthen the existing reproductive health programmes, especially the FP programme, which would help to reduce the TFR.
The result of the study indicated that the major factors influencing fertility in Malawi are the women's age, age at marriage, the ideal number of children, place of residence, education, wealth status, use of FP methods, gender of HH, and child death experienced by mothers.
In line with findings from other studies [29, 41-43], our study found that the number of children ever born is positively related to the age of women. This is expected given that older women have spent more time in childbearing age groups. In addition, older women are more likely to be conservative and traditional to prefer having more children and not adopting any practices to prevent childbearing.
The study also found a negative association between age at marriage and the number of children ever born. This finding is consistent with results from other studies [40, 41]. Marrying early entails that women spend more years in childbearing activities, and if they are not practicing contraception, it will likely lead to high fertility. Moreover, early age at first marriage means early entry into sexual unions and increased exposure to the risk of childbearing, especially in societies that regard the primary function of marriage as procreation. Those who marry early are likely to drop out of school and be unemployed; factors that are associated with high fertility. In addition, women who marry early are likely to get married to older men and consequently be in unequal relationships, resulting in situations where they cannot negotiate contraceptive use [33].
The study also found a positive relationship between the number of children ever born and an ideal number of children. Women who prefer many children are likely to give birth to many children. This finding is consistent with results from other studies [44]. This finding may be due to the fact that women would like to justify the number of children she already has. This phenomenon is described in the literature as rationalization bias [45]. Furthermore, it has been acknowledged that fertility preference is one of the hindrances to the TFR decline in Africa. It influences whether women use contraceptives and their desire to stop childbearing [33, 45, 46].
Another factor associated with high fertility in Malawi is the type of residence. The present study reported that fertility is higher among rural women than urban women. This finding agrees with an earlier study conducted in Malawi [47] and is similar to results from other studies [31, 43, 44]. There are several reasons that could explain rural-urban differences in fertility. The characteristics of urbanites lead to lower fertility. Urban dwellers tend to be more educated than rural dwellers, with better access to information and services on FP.
A negative association was reported between marital fertility and the level of education. Numerous studies have documented that education is a predictor of fertility [28, 42-44]. Educated women are likely to marry late, postpone marriage, use contraception, work outside the home, and have few numbers of children. This is the case because education exposes women to information, empowers them and makes them aware of the consequences of having large families. Other researchers have also demonstrated that education empowers women to reach their fertility targets [48].
A negative relationship was also reported between wealth status and the number of children ever born. This result is the same as for other studies [28, 41, 43]. This finding is consistent with the belief that among poor people, children are seen as an investment, a source of household labour and serves as old-age security [45]. In addition, women from rich households have access to education and are likely to spend more time in school, reducing the amount of time they spend in childbearing. In addition, women from rich households are knowledgeable about contraceptives and have the resources to get them [49].
Moreover, marital fertility was found to be positively associated with contraceptives. This finding is in line with other studies [28, 32, 39]. The finding that the number of children ever born was higher among women who had ever used contraception than those who did not use contraception could arise from the observation that women might consider stopping childbearing and start using contraception when they have reached or exceeded the desired number of children.
The study also found that marital fertility was higher among male HHs than female HHs. This is similar to finding from other studies [32, 44]. One possible explanation for this could be that in a patriarchal society, husbands' desires exert more pressure on women to have more children. Another possibility is that women in the female HHs have high social status. The women’s high status would place them in a good position to negotiate for contraceptive use and less number of children, among other things. Studies have shown that contraceptive use is positively related to women's high social status [49]. High contraceptive use among women in female HHs could, in turn, lead to longer birth intervals and a lower rate of fertility.
Another finding of the study was that marital fertility was negatively influenced by the number of children who died. In other words, marital fertility was reported to be high among women who have experienced child death. Similar findings have been reported in other studies [30, 44, 50]. One possible explanation is the notion of “insurance” fertility, whereby parents bear more children than they ideally want to ensure that they have some children in case some will not survive. In addition, such an association could be explained in terms of the child replacement hypothesis in that the death of a child leads most couples to have another birth to replace the deceased child. One consequence of this finding is that in countries like Malawi, where infant and child mortality are still high, measures that ensure child survival would accelerate the decline in the fertility rate [51].
5. LIMITATIONS OF THE STUDY
There are some limitations in this study. Firstly, the cross-sectional nature of the data used in the study implies that the associations between the variables may not necessarily be a cause-effect relationship. Secondly, determining the number of CEB is influenced by problems of omission, truncation and censoring as it includes the number of children born up to specific points in women's childbearing years. Thirdly, all the variables are subjected to sampling and content errors that could exist in collecting information. Lastly, the inclusion of proximate determinants, such as age at marriage and contraceptive use, is considered to have a direct impact on fertility and may reduce the influence of other social factors.
CONCLUSION
Although the TFR in Malawi is declining, the rate is still high in comparison to other sub-Saharan countries. The study demonstrated that fertility in Malawi is significantly related to the age of the mother, the age at first marriage, the age at birth of the first child, the ideal number of children, education, wealth status, current use of FP and experience of the death of a child. The significant factors influencing fertility in Malawi have implications for policy and programme for the country. Firstly, there is a need to continue educating the masses about the negative effects of early sex, early marriage and early childrearing. Secondly, strengthening women empowerment programs (through initiatives, such as literacy/education strategies and income generating programmes) is critical to not only improve sexual and reproductive health but also lead to fertility decline. Lastly, programmes that focus on improving infant and child survival could also help to reduce the fertility rate.
LIST OF ABBREVIATIONS
| ANOVA | = Analysis of Variance |
| EA’s | = Enumeration Areas |
| CEB | = Children Ever Born |
| DHS | = Demographic and Health Surveys |
| FP | = Family Planning |
| HH | = Household Head |
| MDHS | = Malawi Demographic and Health Survey |
| MG | = Malawi Government |
| NSO | = National Statistical Office |
| OLS | = Ordinary Least Squares |
| SPSS | = Statistical Package for the Social Sciences |
| TFR | = Total Fertility Rate |
| UN | = United Nations |
ETHICAL STATEMENT
National and international standards for biomedical research involving human subjects were adhered to as the survey protocols were ratified by the National Health Sciences Research Committee in Malawi and the ICF Institutional Review Board.
CONSENT FOR PUBLICATION
Not applicable.
AVAILABILITY OF DATA AND MATERIALS
The data supporting the findings of this article is available in the DHS archive and can be obtained by requesting the ORC macro and Measure DHS. The data is available at https://dhsprogram.com/data/available-datasets.cfm.
FUNDING
None.
STANDARDS OF REPORTING
STROBE guidelines were followed.
CONFLICT OF INTEREST
The author declared no conflict of interest, financial or otherwise.
ACKNOWLEDGEMENTS
The author would like to acknowledge the permission granted by DHS, Calverton Macro, USA to use the DHS data. The earlier draft of this paper was presented at the 2018 Annual Population Association of America Congress held from 26-28 April, 2018, in Denver, Colorado. The participation of the author at the congress was possible through financial support received from the North-West University, Faculty of Humanities Research Committee.

