All published articles of this journal are available on ScienceDirect.

The Importance of the Frailty Effect In Survival Models: For Multidrug-resistant Tuberculosis Data
Abstract
Background:
Frailty models have been proposed to analyse survival data, considering unobserved covariates (frailty effects). In a shared frailty model, frailties are common (or shared) amongst groups of individuals and are randomly distributed across groups.
Objective:
In this paper, the authors compared the semi-parametric model to shared frailty models by studying the time-to-death of patients with multidrug-resistant tuberculosis (MDR-TB).
Methods:
Secondary data from 1 542 multidrug-resistant tuberculosis patients were used in this study. STATA software was used to analyse frailty models via the streg command.
Results:
Of 1 542 patients diagnosed with MDR-TB, 245 (15.9%) died during the study period; 77 (5.0%) had treatment failure; 334 (21.7%) defaulted; 213 (13.8%) completed treatment; 651 (42.2%) were cured of MRD-TB; and 22 (1.4%) were transferred out. The results showed that 797 (51.7%) were females, and the majority were aged 18 – 30 and 31 – 40 years (35.5% and 35.7% respectively). Most of the patients (71.3%) were HIV-positive. The results also showed that most patients (95.7%) had no previous MDR-TB episodes, and 792 (51.4%) had no co-morbidities. The estimate of the variance for the frailty term in the Weibull gamma shared frailty model was 2.83, which is relatively large and therefore suggests the existence of heterogeneity.
Conclusion:
The Laplace transform of the frailty distribution plays a central role in relating the hazards, conditional on the frailty, to the hazards and survival functions observed in a population.
1. INTRODUCTION
Time-to-event data measure the time elapsed from a given origin to the occurrence of an event of interest. Most commonly, survival data are handled using the proportional hazards (PH) regression model popularized by [1]. Correct inference based on those PH models requires independent and identically distributed samples. The PH assumption states that the ratio of the hazards between any two individuals is constant over time, and a non-parametric “baseline hazard gives the shape of the hazard”. Subjects may be exposed to different risk levels, even after controlling for known risk factors, because some relevant covariates are often unavailable to the researcher or are even unknown (univariate case). The study population may also be divided into clusters so that subjects from the same cluster behave more cohesively than subjects from different clusters (multivariate case).
A frailty model introduced by [2] that quickly gained popularity in econometrics [3], demographics [4] and biostatistics [5] is a heterogeneity model where the frailties are assumed to be individual, and the frailty has a multiplicative effect on the baseline hazard function. The estimate of the random effect is assumed to have a unit mean and finite variance. Individuals with a frailty greater than one are said to be frailer and will have an increased risk of failure. When the variance of the frailty term is equal to zero, this indicates that observations from the same group are independent. Therefore, when the standard model fails to account for all the variability in the observed failure times, frailty models provide a useful alternative to a standard survival model. The main assumption of a frailty model is that information about hidden internal or external factors is contained in the shape and structure of the hazard function and the form of the frailty distribution [6].
Frailty models have two broad classes, namely models describing the univariate survival times and multivariate models. Frailty models for univariate data have long been used to account for heterogeneous times-to-failure. The term ‘frailty’ was first suggested by [2] in the context of mortality studies, and [7] incorporated the frailty concept into a study of the duration of unemployment. The shared frailty model may be considered a random-effects model for survival data because the frailty effect is shared amongst clusters of individuals. Early considerations of these models can be found in [8-12].
Although several research papers have been published on frailty models, even in the modelling of infectious diseases [13, 14], to the best of the authors’ knowledge, no study has been conducted in KwaZulu-Natal, South Africa, applying shared frailty models to survival data. This paper is intended to demonstrate the analysis of frailty models using secondary data from 1 542 MDR-TB patients who were treated in KwaZulu-Natal, South Africa. This study used the statistical software called STATA version 19 to analyse data.
2. METHODS
2.1. Data Source
The data used in this study are described in [15]. The study protocol was approved by the University of KwaZulu-Natal’s Biomedical Research Ethics Committee (Ref: BF052/09) and by the KwaZulu-Natal Department of Health. According to [15], they used data collected by health workers for clinical care. No risks were posed to the patients and informed consent was waived by the ethics committee. The authors report that to protect patient confidentiality and anonymity, the databases were de-identified and access was strictly limited.
According to the researchers [15], their study was a prospective study of 4 rural areas in KwaZulu-Natal (South Africa) between 1 July 2008 and 30 June 2012. In this study, the authors used data from 1 542 MDR-TB patients from five TB centres (four decentralized sites and one centralized hospital). Time-to-death of an MDR-TB patient is the response variable of interest.
2.2. Model Development
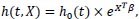
In general, frailty models are the equivalent of random-effects or mixed models in survival analysis. Suppose that X represents a covariate vector, let T be a non-negative random variable representing an individual survival time, with t being a realisation of that random variable, then the Cox proportional hazard (PH) model is:
 |
(1) |
where X = [X1, X1,...,Xn] and β = [β1, β1,...,βn] is a regression parameter vector.
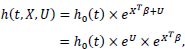
A frailty model introduces the unobserved components represented by a vector denoted as U, and (1) is modified as follows:
 |
(2) |
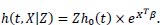
Let Z = eU represents the frailty term, then the frailty model is:
 |
(3) |
The baseline hazard function h0 (t) can be chosen non-parametrically or parametrically (Weibull, exponential, Gompertz, etc.). There are two distinguishable broad classes of frailty models, namely the univariate frailty model and the multivariate frailty model.
2.3. The Univariate Frailty Model
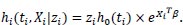
Suppose that an individual is affected with MDR-TB and has a survival time denoted as ti, covariate vector Xi, with a frailty term denoted as Zi [2], stated that the hazard function of the individual i is given as:
 |
(4) |
Since Zi is an unobservable random variable varying over the sample. Those individuals who possess Zi 1 are said to be more frail and will have an increased risk of failure. Conversely, those individuals with Zi < 1 are less frail and will tend to survive longer.
The model of an individual i can also be represented by its conditional survivor function:
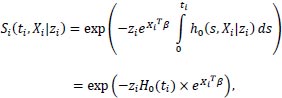 |
(5) |
and 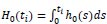 is the cumulative baseline hazard function.
The model described above is at the individual level, but this individual model is not observable [16]. It is vital to state that this is the reason why the model is considered at a population level. Survival of the total population is the mean of the individual survival functions.
The unconditional survival function of an individual i at the population level is:
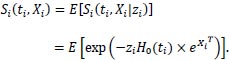 |
Knowing the frailty distribution can help one determine an individual's unconditional survival function, and this is the same for the unconditional hazard (average hazard).
2.4. The Distribution of Frailty
The average hazard of an individual i, given the conditional hazard, is:
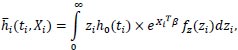 |
assume that h0 (ti) is a constant, then:
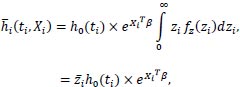 |
where 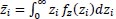 is the mean frailty.
Suppose Xi is one covariate representing a variable “study site”, which is 0 = Centralized hospital, 1 = Decentralised sites:
 |
(6) |
This shows that the average hazard depends on the frailty distribution.
Many distributions can be chosen for frailty, including gamma frailty; the log-normal distribution; the positive stable frailty model; the inverse Gaussian frailty model; and the compound Poisson frailty model, amongst others [17, 18]. The gamma distribution has been used in most applications and widely applied as a mixture distribution due to the simplicity of the Laplace transformation [2, 8, 19-21].
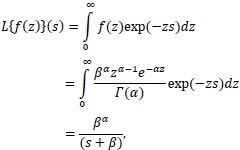 |
Where the parameter s is a complex number:
s = a + ib
with a and b real numbers.
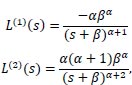
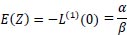
Many calculations can be performed based on the Laplace transform. The importance of the Laplace transform for these calculations has previously been demonstrated [22]. The mean and variance of the Gamma distribution can be obtained by using the first and second derivatives of the Laplace transform, respectively.
 |
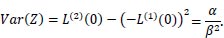
on evaluating the derivatives at s = 0,
 |
and
 |
Another reason that this distribution has been used in most applications published to date is that it is a flexible distribution that takes a variety of shapes as α varies. That is:
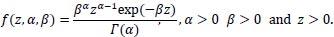 |
Where α and β are the shape and scale parameters, respectively.
The mean is  and the variance is
  .
.
If α = 1, it is identical to the well-known exponential distribution. When α is large, it takes a bell-shaped form. The gamma distribution fits very well with failure data because it is easy to derive the closed-form expressions of unconditional survival, cumulative density and hazard function.
2.5. Multivariate Frailty Model
Survival data analysis always assumes that the time-to-event of the individuals considered in the study is independent. However, this may not always be the case because there is a possibility that the survival times of individuals in the same group, for example, in a family or community, are correlated. The correlation between survival time violates the independence assumption, and such data cannot be analysed using the univariate semi-parametric model. According to [23], the data with correlated survival times are known as multivariate survival data, and models developed to analyse such data include the shared frailty model, which was previously introduced [2, 8].
The model is called the shared frailty model because individuals in the same cluster are assumed to share the same frailty [6, 24]. The survival times of individuals within the same group are assumed to be conditionally dependent, while the frailty across the groups is assumed to be independent. However, when a frailty term represents the individual's unmeasured or unobserved covariates after considering the measured covariates, it is called the univariate frailty model.
Let N denote the number of individuals in a given cohort, with each individual in the cohort assigned to a cluster. Let the total number of clusters be denoted by G such that, given the ith cluster consists of ni individuals, then:
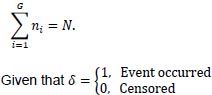 |
is the censoring indicator. The response variable will be a combination of time-to-event and δi, which takes a value 1 if the time-to-event is observed and 0 if censored or the event did not occur.
The hazard function of the jth individual of the ith cluster is given as:
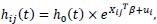 |
(7) |
where Xij is a vector of covariates for individual j in the ith group, ui is the unobserved covariates and h0 (t) is the baseline hazard function.
Since zi = eui, the hazard function can be written as:
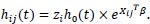 |
(8) |
Here, the  are independent with an identical probability density function denoted as f(z).
The full likelihood of the shared frailty model is given as follows:
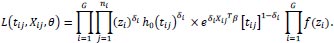 |
(9) |
2.6. Parametric Frailty and Shared Frailty
Now consider a parametric survival model which is characterized by its hazard function, h(t). The effect of any covariate is always found in the definitions of all these functions, whether one parameterizes the model as having PH with respect to changes in covariate values or accelerated failure time (AFT) due to the covariates. For instance, in a Weibull PH regression, the hazard function at time t for individual i with covariate vector xi is:
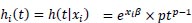 |
(10) |
The shape parameter p and regression coefficients β are estimated from the data. The streg contains a list of those forms of h(t) currently available in STATA. In the univariate case, a frailty model introduces an unobservable multiplicative effect z on the hazard, so that conditional on the frailty
 |
(11) |
where z is some random positive quantity assumed to have a unit mean equal to one and variance equal to θ.
A multivariate survival model is an extension of the univariate frailty model, where individuals are allowed to share the same frailty value. Sharing a frailty value also generates dependence between those individuals who share frailties, whereas conditional on the frailty, those individuals are independent. For data consisting of n clusters with the ith cluster comprised of ni individuals (i = 1,...,n), (11) generalizes to
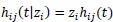 |
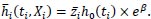
for j = 1,2,...,ni with hij(t) = h(t|xij). That is, for any member of the ith cluster, the standard hazard function is now multiplied by the shared frailty zi. For instance, in the case of Weibull PH regression, the conditional hazard for an individual is given by
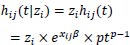 |
and the conditional survival function is
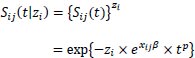 |
2.7. Statistical Methods
Data analyses were conducted using STATA version 19 and the Statistical Package for the Social Sciences (SPSS version 25). Basic descriptive statistics, such as frequencies and percentages of demographics, were calculated. The proportion of successful treatment is those cured and treatment completed, and those patients who did not finish treatment, such as those loss to follow-up and failed, are considered to have poor treatment outcomes.
Firstly, the authors fit a Cox PH model and then fit a Weibull regression model with gamma-distributed heterogeneity. Since correlation within a “site” might exist for a given patient, one can model this as a shared frailty model where the sharing occurs at the patient level. This is easily done by adding the option shared (patient) to the streg, frailty.
3. RESULTS AND DISCUSSION
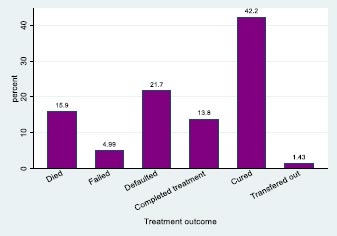
The study considered an MDR-TB data set consisting of 1 542 patients with time-to-death as the primary outcome of this study. A total of 245 (15.9%) patients with MDR-TB died between 1 July 2008 and 30 June 2012, and 77 (5.0%) had treatment failure. A total of 334 (21.7%) patients were defaulted, 213 (13.8%) completed treatment; 651 (42.2%) were cured of MRD-TB; and 22 (1.4%) were transferred out (Fig. 1 and Table 1).
The baseline demographics of the patients treated with MDR-TB showed that 797 (51.7%) were females, and the majority of the patients were aged 18 – 30 years and 31 – 40 years (35.5% and 35.7%, respectively). Most of the patients (71.3%) were HIV-positive. The results also show that most of the patients (95.7%) had no previous MDR-TB episodes, and 792 (51.4%) had no co-morbidities. Furthermore, 1510 (97.9%) of the patients had pulmonary TB (Table 2). The median follow-up time was 26.8 months.
| Treatment Outcomes | Site 1 | Site 2 | Site 3 | Site 4 | All Decentralized Hospitals | Centralized Hospital |
|---|---|---|---|---|---|---|
| n = 125 | n = 142 | n = 202 | n = 261 | n = 730 | n = 812 | |
| Died | 17 (13.6) | 21 (14.8) | 25 (12.4) | 69 (26.4) | 132 (18.1) | 113 (13.9) |
| Failed | 7 (5.6) | 10 (7.0) | 12 (5.9) | 19 (7.3) | 48 (6.6) | 29 (3.6) |
| Defaulted | 9 (7.2) | 18 (12.7) | 50 (24.8) | 28 (10.7) | 105 (14.4) | 229 (28.2) |
| Completed treatment | 12 (9.6) | 8 (5.6) | 19 (9.4) | 15 (5.7) | 54 (7.4) | 159 (19.6) |
| Cured | 78 (62.4) | 79 (55.6) | 94 (46.5) | 120 (46.0) | 371 (50.8) | 280 (34.5) |
| Transferred out | 2 (1.6) | 6 (4.2) | 2 (1.0) | 10 (3.8) | 20 (2.7) | 2 (0.2) |
| Variables | n (%)/Median (IQR) | ||||||
|---|---|---|---|---|---|---|---|
| Site 1 (n=125) | Site 2 (n=142) | Site 3 (n=202) | Site 4 (n=261) | All decentralized hospitals (n=730) | Centralized hospital (n=812) | TOTAL (n=1542) | |
| Baseline weight (kg) | 50 (43 - 59) | ||||||
| Age (in years) | 34 (28 - 42) | ||||||
| Age groups | - | ||||||
| 18 - 30 | 42 (33.6) | 44 (31.0) | 74 (36.6) | 85 (32.6) | 245 (33.6) | 303 (37.3) | 548 (35.5) |
| 31 - 40 | 43 (34.4) | 55 (38.7) | 70 (34.7) | 90 (34.5) | 258 (35.3) | 292 (36.0) | 550 (35.7) |
| 41 - 50 | 30 (24.0) | 27 (19.0) | 40 (19.8) | 56 (21.5) | 153 (21.0) | 145 (17.9) | 298 (19.3) |
| 50+ | 10 (8.0) | 16 (11.3) | 18 (8.9) | 30 (11.5) | 74 (10.1) | 72 (8.9) | 146 (9.5) |
| Gender | - | ||||||
| Male | 57 (45.6) | 60 (42.2) | 104 (51.5) | 125 (47.9) | 346 (47.4) | 399 (49.1) | 745 (48.3) |
| Female | 68 (54.4) | 82 (57.7) | 98 (48.5) | 136 (52.1) | 384 (52.6) | 413 (50.9) | 797 (51.7) |
| HIV status | - | ||||||
| Positive | 96 (76.8) | 108 (76.1) | 123 (60.9) | 197 (75.5) | 524 (71.8) | 576 (70.9) | 1100 (71.3) |
| Negative | 28 (22.4) | 30 (21.1) | 66 (32.7) | 38 (14.6) | 162 (22.2) | 211 (26.0) | 373 (24.2) |
| Unknown | 1 (0.8) | 4 (2.8) | 13 (6.4) | 26 (10.0) | 44 (6.0) | 25 (3.1) | 69 (4.5) |
| Previous MDR-TB episodes | - | ||||||
| No previous episodes | 119 (95.2) | 124 (87.3) | 184 (91.1) | 246 (94.3) | 673 (92.2) | 802 (98.8) | 1475 (95.7) |
| One previous episode | 5 (4.0) | 18 (12.7) | 18 (8.9) | 14 (5.4) | 55 (7.5) | 9 (1.1) | 64 (4.1) |
| Two previous episodes | 1 (0.8) | 0 (0) | 0 (0) | 1 (0.3) | 2 (0.3) | 1 (0.1) | 3 (0.2) |
| Comorbidities | - | ||||||
| No other diseases | 6 (40.0) | 2 (15.4) | 1 (100) | 0 (0) | 9 (20.5) | 780 (97.6) | 789 (93.6) |
| Diabetes | 1 (6.7) | 1 (7.7) | 0 (0) | 8 (53.3) | 10 (22.7) | 10 (1.3) | 20 (2.4) |
| Epilepsy | 4 (26.7) | 3 (23.1) | 0 (0) | 1 (6.7) | 8 (18.2) | 4 (0.5) | 12 (1.4) |
| Hearing loss prior to start of treatment | 2 (13.3) | 3 (23.1) | 0 (0) | 5 (33.3) | 10 (22.7) | 1 (0.1) | 11 (1.3) |
| Renal problems | 1 (6.7) | 2 (15.4) | 0 (0) | 0 (0) | 3 (6.8) | 0 (0) | 3 (0.4) |
| Substance abuse | 1 (6.7) | 2 (15.4) | 0 (0) | 1 (6.7) | 4 (9.1) | 0 (0) | 4 (0.5) |
| Psychiatric problems | 0 (0) | 0 (0) | 0 (0) | 0 (0) | 0 (0) | 4 (0.5) | 4 (0.5) |
| Type of TB | - | ||||||
| Pulmonary | 122 (97.6) | 131 (92.3) | 199 (98.5) | 254 (97.3) | 706 (96.7) | 804 (99.0) | 1510 (97.9) |
| Extra pulmonary | 3 (2.4) | 11 (7.7) | 3 (1.5) | 7 (2.7) | 24 (3.3) | 8 (1.0) | 32 (2.1) |
The results in Table 3 show the Cox regression parameter estimates, Weibull shared frailty parameter estimates and log-normal frailty parameter estimates. The results also show the chi-square test statistic (X2 = 4.19) for a Weibull frailty model with a p-value of 0.02. The estimate of the variance for the frailty term in the Weibull gamma shared frailty model is 2.83, which is different from zero. This implies that unobserved heterogeneity was present at the site level. Therefore, one can use the Weibull frailty shared model because the results suggest that patients at some sites were associated with a higher risk of dying than the other sites and there is a difference in the conclusions drawn about the dataset.
Further evidence is the differences in the coefficient estimates between the Weibull frailty model and the ordinary Cox regression model. Hazard ratios now have an interpretation that is conditional on frailty. Note that the standard deviation increases in the gamma frailty and log-normal models. The log-normal model results in a slightly lower likelihood ratio test. If one looks at the results produced by the log-normal frailty model, the frailty variance is zero and is not significant. This implies that all the differences amongst the mortality rates of the MDR-TB patients are explained by the observed fixed covariates stated in the model. That is, the log-normal model indicates that there is no unobserved heterogeneity amongst groups (sites), but the estimate of the standard errors increased.
When comparing the estimates of the standard Cox PH model and those of the Weibull gamma frailty model, an increase in the estimates was observed after correcting for frailty (Table 3). Factors strongly associated with mortality rates were identified by examining their confidence intervals (CIs) and p-values. Factors whose CIs include 1 implied that these factors were insignificant and these results were confirmed by p-values > 0.05 significance level. Baseline weight, age group (31- 40) and gender were found to be strongly associated with mortality rates. The results show that patients treated in decentralized sites had a lower death rate than those treated in centralized sites, but this was insignificant.
4. DISCUSSION
Frailty models are mixture of models within survival analysis. The estimation in this general frailty model framework is performed by using a simple two-step procedure where the fixed effects and the individual frailty terms are estimated while keeping the frailty variance parameter fixed. This procedure leads to simple estimation equations but results in an underestimation of the estimated variances of the fixed effects parameters because the variance estimation does not take into account the variability in the estimation of
The objective of this paper was to assess the effect of omitting unmeasurable variables in the modelling exercise. The researchers began by fitting a semi-parametric stratified Cox regression model with random effects and then fitted a Weibull parametric stratified model with random effects. This was an extension of the stratified Cox regression model with the site variable as the stratifying variable. The results of the exercise suggested that there exists significant unobserved heterogeneity. When accounting for site effects, the confidence intervals are wider in the Weibull frailty model, which implies that there is much more heterogeneity at decentralized sites than in the centralized hospital.
The other factors included in the analysis, namely HIV status, type of TB, previous MDR-TB episodes and co-morbidities, affect on the survival time of MDR-TB patients. Still, there was not enough evidence from the data to confirm their association with this survival time.
The results in this paper do not deviate much from the findings obtained by [27], who concluded that frailty is a strong predictor of mortality, as has been shown by previous systematic reviews [28-30]. Two of these reviews systematically conducted studies that used different definitions of frailty, including the frailty phenotype by [31] and the frailty index (FI) by [32], and demonstrated that frailty consistently increased the risk of death in most studies [28, 29].
When comparing the Cox PH model to the frailty models, it was found that the estimates of the standard error for the fixed effects increased. In some cases, adding a frailty term can render a result insignificant in the frailty model even though it was significant in the Cox PH model [33].
A follow-up study may be a good alternative to MDR-TB surveys. In this case, a cohort of patients may be followed from different cities. In this paper, the researchers considered only models with gamma or log-normal frailty. This approach can be easily extended to other frailty distributions available, such as inverse Gaussian distributions. However, the approach for the positive stable distribution [19], which is expressed as a Laplace transform, would be interesting future work.
CONCLUSION
This study shows that the gamma frailty model provides a better fit to the MDR-TB data than the standard Cox model. Although further research must be conducted about the models, an initial investigation suggests that the models will serve as an enhancement to the field of survival analysis. The authors conclude that frailty in a survival model is an important consideration and is especially useful in situations where clustering needs to be accounted for.
LIST OF ABBREVIATIONS
| STATA | = Statistics and data |
| MDR-TB | = Multidrugresistant tuberculosis |
| TB | = Tuberculosis |
| FI | = Frailty index |
LIMITATIONS
The findings should be interpreted with caution due to a few limitations. Some covariates that were included in the model had missing information. The major problem with this is that the quality of the results might decrease due to less completeness of the data. Furthermore, some patients who were included in the study were lost to follow-up.
AUTHORS’ CONTRIBUTIONS
All the authors made contributions to this paper. SVM planned the study, wrote the paper's initial draft, and did the analysis. HW and SR revised and edited the paper. All authors read and approved the final work of this manuscript.
ETHICS APPROVAL AND CONSENT TO PARTICIPATE
The study protocol was approved by the University of KwaZulu-Natal’s Biomedical Research Ethics Committee (Ref: BF052/09) and by the KwaZulu-Natal Department of Health. Only secondary data, the data routinely collected by health workers for clinical care, was used in this study.
HUMAN AND ANIMAL RIGHTS
No animals were used in this research. All procedures performed in studies involving human participants were in accordance with the ethical standards of institutional and/or research committees and with the 1975 Declaration of Helsinki, as revised in 2013.
CONSENT FOR PUBLICATION
Informed consent was waived by the ethics committee since all patient data used were previously collected during the course of routine medical care and did not pose any additional risks to the patients.
AVAILABILITY OF DATA AND MATERIALS
Data will be made available upon request but will be controlled. To protect patient confidentiality and anonymity, the data bases were de-identified and access strictly limited.
ACKNOWLEDGEMENTS
The authors thank Dr. Marian Loveday and Prof Glenda Matthews for allowing them to use their dataset. They thank all facility-level managers, doctors, nurses and data capturers at the study sites for their assistance.

