All published articles of this journal are available on ScienceDirect.

Linking Jakarta’s Typical Indonesian Urban Context, Air Pollution, and Child Health
Authors Info & Affiliations
Abstract
Introduction:
Jakarta, the second largest metropolitan area in the world after Tokyo, has experienced rapid development that may not have adhered to the established urban planning regulations. These have caused multiple urban health risk issues, such as high private transportation use, coal-powered plants, lack of green spaces, and industrialization. All of regulations have contributed to the high level of air pollutants in Jakarta Metropolitan Area (JMA). Air pollution is one of the most significant health problems in the world and children are especially exposed confirmed. The fact that children’s organs are still in growth and development phase means that they are especially susceptible to the pollutants entering the body. Existing data showed that the air pollutants in JMA, specifically PM2.5, SO2, NO2, and CO are categorized as moderate to high compared to the international standards, therefore, could potentially become a contributing factor to the mortality and morbidity of children living in Jakarta.
Conclusion:
More aggressive approaches are required to tackle air pollution issues, especially because the United Nations News. UN General Assembly declares access to clean and healthy environment a universal human right. 2022. Available from: https://news.un.org/en/story/2022/07/1123482.
1. INTRODUCTION
In recent decades, the number of people living in urban areas is growing all over the world. United Nations. Handbook of Statistics 2021. New York: United Nations Publications 2021 [1]. The proportion is higher in developed countries, compared to those in the developing economic stage [2]. Additionally, the World Health Organization (WHO) has expected the number to increase to nearly 70% by 2050 [3]. A similar trend is seen in Indonesia, where the urban population increased from 17.8% in 1972 to 57.3% in 2021, with an average annual rate of 2.42% [4].
The places where we live, work, and play contribute significantly to our health risks and outcomes. Social determinants of health and different settings are important for e.g., urban versus rural settings, which can have different effects [5]. Characteristics of the urban environment may influence health within a particular city, which include the social and physical environment [6]. The social urban environment comprises social norms and attitudes. At the same time, physical environment refers to the infrastructure, transportation systems, green space, and other physical features in a city. These specific characteristics of a city affect the health of urban dwellers, resulting in different health outcomes compared to the population living in rural areas [7]. Urban dwellers have better access to healthcare and higher medical expenditure but are more dependent on activities and daily living than their rural counterparts [8].
In addition, there is also an increasing trend of urbanization, referring to the population movement from rural to urban areas. Urbanization presents opportunities for individual development and better access to social and health services, but it may also result in various health problems, such as risk of infectious diseases, air pollution, poor nutrition, poor sanitation, and others [9]. One of the major issues in urban health is related to the health impact of air pollution. Poor urban planning, traffic, heat, and noise in cities are substantially higher than in rural areas. About 78% of carbon emissions are produced in cities, and the majority of airborne pollutants are affecting people who live in urban areas [11, 12]. Particularly, compact cities have higher heat than urban islands that attract more air pollutants [13].
This review will provide an overview of the urban conditions in Jakarta Metropolitan area (JMA) as it is one of the most crowded cities in the world, and how the air pollution in urban areas could potentially affect the health of children in the city. WHO reported the negative impact of air pollution on child health, with one in every four deaths of under-five children being associated with air pollution [11]. A literature review was performed to obtain objective data related to air pollution in Jakarta Metropolitan Area and some theories proposed to link it with child health.
1.1. Urban Planning in Jakarta Metropolitan Area
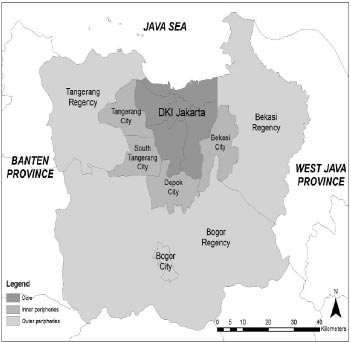
The special Capital Region of Jakarta (DKI Jakarta) is the capital city of Indonesia. Since the 1960s, Jakarta has massively developed into a megacity. The area has been stretched to include the surrounding districts. DKI Jakarta alone consists of five municipalities, i.e., North Jakarta City, Central Jakarta City, West Jakarta City, South Jakarta City, and East Jakarta City. These municipalities are divided into 42 subdistricts (Kecamatan) covering 262 urban villages (Kelurahan) that are composed of 2,718 citizen associations (Rukun Warga/RW) [14]. The term Jakarta Metropolitan Area (JMA) refers to the area of Jakarta, Bogor, Depok, Tangerang, and Bekasi, or known as “Jabodetabek”. It comprises the core, inner periphery, and outer periphery. The core area is DKI Jakarta. The inner peripheries include Tangerang City, South Tangerang City, Depok City, and Bekasi City, while the outer peripheries are Tangerang Regency, Bogor City, and Bekasi Regency. Fig. (1) depicts the area of JMA. DKI Jakarta Province is surrounded by Banten Province on the left side and West Java Province on the right.
In terms of size, JMA covers a total area of nearly seven thousand kilometers [15]. Jakarta is considered as a metropolitan area. According to the Organisation for Economic Co-operation and Development (OECD), metropolitan areas are composed of a city surrounded by commuting zones. Compared to other metropolitan areas, Bangkok is almost 3 times and Shanghai is nearly 10 times bigger than Jakarta [16]. Nevertheless, the population density of JMA exceeds Bangkok (5,294 people per km2) [17] and Shanghai (2,059 people per km2) [18], with 13,000 people per km2 [19]. High population density has been linked with poor health outcomes, such as increasing risk of overweight, sedentary lifestyle, smoking, stress, and even mortality [20, 21].
In the most updated regulation (Presidential Regulation 60/2020), the urban planning of JMA still focuses on the role of Jakarta as an economic activity centre. High-rise buildings, including residential, service, and commercial buildings grew at a rapid pace in response to the convenience of the automobile and the high costs of land. In the outskirts of JMA, agricultural areas, and forests were converted massively into industrial complexes and new towns. The political transformation of Indonesia does not have any significant impact on spatial planning [22]. With the conversion of residential areas into commercial areas, there are also changes in the population density. The population in the core areas is declining, but that residing in the peri-urban is increasing with migration from both core areas and surrounding rural areas for better housing and work prospects [23]. Nevertheless, about 3.2 million people commute daily from Bogor, Depok, Tangerang, and Bekasi to DKI, Jakarta, using motorcycles and public transportation [24]. Most people reside in the outer peripheries and work in the core area. A good transportation system is crucially needed to mobilize 1.3 million trips per day from the peri-urban to the economic centre in JMA core areas, and 17 million trips per day within Jakarta. This is usual for metropolitan areas.
Satellite image analysis showed that JMA has expanded at a rapid pace from a definition of urban sprawl up until 2008, and it was only around 2015 that the development became more focused toward a compact city [25]. Even though the sprawling development of JMA has been halted, the highway expansion in JMA has actually discouraged the convergence of urban areas into compact city area, further pushing forward the need for a good transportation system [26].
As the large-scale development in the peri-urban area caters mostly for the high and upper-middle class, all social classes can be found in the peri-urban areas, albeit within different segregated regions [27]. JMA not only has high-rise buildings but also consists of slum areas that are densely populated areas in urban cities that have low housing standards and high levels of poverty [28]. About 16.4% (445/2,718) of RW is considered a slum area as stated in DKI Jakarta Provincial Governor Regulation Number 90 Year 2018, in which 3.4% of these areas are classified as heavy slum category. Legarias et al. revealed that these heavy slum areas are located near industrial and office zones, indicating economic opportunities as the main attraction for urban dwellers [14]. The health outcomes of people living in slum areas are considerably worse than those in rural areas. Childhood morbidity and mortality are higher in slums than in non-slums. Even though geographical access would not hamper the provision of health services, but financial access can still be an issue for those living in slums [29].
The existence of urban green space has been found to improve human health and motivate physical activities [30]. Jakarta was originally designed to have 27.6% green space, as planned in the 1965-1985 Jakarta Master Plan. Unfortunately, the space has been reduced to 13.9% in the 2000-2010 Jakarta Spatial Plan. The green space is below the minimum allocated area as stated in the Spatial Planning Law, i.e., 30% of green spaces [22]. While Jakarta merely had 5.31% of green spaces in 2019 [31]. Compared to other urban cities, Jakarta has much less green space. For instance, Shanghai Municipal Government emphasized that by 2020, the green space must exceed 50% of its land area [32]. Repeated disregard for spatial planning has encouraged urban sprawl and the reduction of open green spaces. The industrialization of peri-urban areas of JMA and the ineffective transportation system forcing the high use of private vehicles, contribute to the high level of air pollution in JMA.
1.2. Air Pollution in Jakarta
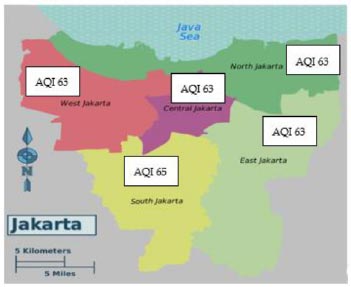
Air Quality Index reports daily air quality that shows the purity of the air and the potential health effects that might be a concern. AQI has 6 scales, namely, good (AQ1 0-50), moderate (AQI 51-100), unhealthy for sensitive groups (AQI 101-150), unhealthy (AQI 151-200), very unhealthy (AQI 201-300), and hazardous (AQI 301-500). According to the World Air Quality Report [33], Jakarta is the ninth most polluted capital city in the world. In Southeast Asia, three cities from the JMA region were included in the top ten most polluted cities in the region, with South Tangerang holding the first position. Fig. (2) describes the air quality index (AQI) that ranges between 51-100 in the Jakarta area, which is categorized as a moderate level per February 2022.
WHO Global Air Quality Guidelines provide thresholds and limits for key air pollutants that pose health risks. It covers 4 main pollutants that are particulate matter (PM), especially PM10 and PM2.5, ozone (O3), nitrogen dioxide (NO2), and sulfur dioxide (SO2). Lestari et al. [34] stated in 2020 that projecting from the actual data between 2005-2015, the total energy used in the core of JMA, Jakarta, would be 372.29 petajoules, which is shared between industrial combustion (29.7%), road transport (28.2%), power and heating plants (25.9%), and residential combustion (16.2%). The emission load for NOx in 2015 was estimated to be 52.9 kilotonnes, contributed mostly by road transportation (57%), followed by power plants (24%). The total emission load for CO was 143.9 kilotonnes, dominated by road transportation (93%) and the industrial sector (4%). On the other hand, the total SO2 emitted in Jakarta (19.7 kilotonnes) was dominated by industrial combustion (67%) and power plants (25%). For PM2.5, the total emission of 4.6 kilotonnes was mostly road transportation (46%) and industrial combustion (43%). Compared to WHO global air quality guidelines, the pollutants in this report are higher than the standard.
https://upload.wikimedia.org/wikipedia/commons/thumb/9/92/Jakarta_Wikivoyage_Map.svg/512px-Jakarta_Wikivoyage_Map.svg.png). Note: AQI = Air Quality Index, with the following range: 0-50 (good), 51-100 (moderate), 101-150 unhealthy for sensitive people, 151-200 (unhealthy), 201-300 (very unhealthy), 301-500 (hazardous).
Santoso et al. [35] found that Jakarta experienced increased PM2.5 daily and annual concentrations. Even though the Black Carbon (BC) percentages varied by year, the change was minor compared to the total PM2.5. BC is commonly emitted by high-temperature combustion, such as diesel engines and biomass burning. Sulphur (S) had the highest concentration compared to the other elemental concentrations; fine particulate sulphur was usually delivered from coal-fired power plants, refineries, and industries. The annual average of Pb concentrations in Jakarta was lower than the threshold by USEPA, which may be linked to the elimination of leaded gasoline in Indonesia since 2001. However, Pb peaking can be observed throughout the years, possibly related to the industrial activity in Tangerang, one of the supporting cities of JMA (lead bar production and battery recycling activity). Analysis by Santoso et al. [36] confirmed that Tangerang has one of the highest Pb concentrations in the ambient air compared to the other fifteen cities within and outside Java.
However, the existing projection and analysis may be skewed to the worst conditions in the future, especially regarding the air pollution contributed by power plants. In 2017, there were nine existing units of coal-fired power plants within 100 km of central Jakarta; if the current plan to build another six coal-fired power plants was realized, JMA would be the capital city with the largest number of coal-powered plants in the world. Myllyvirta & Chuwah [36] estimated that the existing power plants have exposed the western and northern parts of JMA (Jakarta, Tangerang) to air pollutants concentrations in the form of SO2, NOx, PM2.5, and mercury to hazardous levels. However, with the addition of new power plants, the air pollutant exposure would be significantly widened to include the eastern and southern parts of JMA (wider Jakarta, Bekasi, Depok, Bogor).
In 2020, in response to the COVID-19 pandemic, several restrictions on movement have been imposed in JMA [37]. Several variations of the social restriction happen throughout the year, but in general, the restriction includes closing of schools and offices (except essential services), implementing work from home, closing religious places, and banning mass gathering events. It turned out that even though CO and NO2 displayed a downward trend during the social restriction, no impact was observed on SO2 concentration levels [37]. As CO and NO2 were mostly emitted by road transportation in JMA,however, because of the existing power plants near North Jakarta, no improvement in SO2 concentration levels was observed [37].
1.3. Air Pollution and Child Health in Jakarta
Air pollution has been concluded to be one of the most significant health problems in the world [38]. Globally, nine out of ten people are exposed to polluted air, and seven million people are estimated to die annually because of air pollution [39]. Those residing in urban areas have undeniably more exposure to air pollution, mainly due to road or industrial emissions [40]. As Jakarta also has a high proportion of slum areas and a high level of urbanization, these lead to poor air quality. A study performed in 2010 showed that 60% of Jakarta residents had respiratory distress due to air pollution. Sore throat, cough, and eye irritation were the most common complaints among the public [41].
By comparing the exposure level to PM10 with the self-reporting data from Susenas (National Socioeconomic Survey), Amalia et al. [42] concluded that children in JMA are more exposed to air pollution compared to adults and the elderly, especially regarding restricted activity days. Children are especially vulnerable to air pollutants due to the combination of behavioural, environmental, and physiological factors. First, the longer life expectancy of children means that they will be exposed for a longer time than adults. Second, children physiologically breathe faster than adults, and because of their physique, they live closer to the ground, which means that both factors increase the exposure of children to air pollutants. Third, children have much more outdoor activities compared to adults. They also have less capability to challenge the polluted environment with their organ system still in the growth and development phase [11]. All these reasons lead them to higher exposure to air pollution and therefore, result in a higher risk of morbidity and mortality.
Children exposed to oxidants such as nitrogen dioxide (NO2) are more likely to develop asthma, allergic rhinitis, and eczema [43, 44]. Exposure to NO2 is also linked to behavioural development in children, such as ADHD [45] or Alzheimer’s Disease pathology [46]. Long exposure to NO2 is also related to elevated blood pressure among children, which is a risk for hypertension and metabolic syndrome later in their lives. Systemic inflammation caused by exposure to pollutants can also cause endothelial injury, atherosclerosis, and thrombosis, increasing the risk for cardiovascular diseases such as coronary heart disease and ischemic stroke. The same systemic inflammation is also linked to cardiac arrhythmia, which also contributes to cardiovascular diseases later in life. Obesity, diabetes mellitus, and dyslipidaemia are also linked to systemic inflammation caused by oxidants such as NO2, even though PM2.5 has a bigger role [47, 49]. The existing evidence on early exposure to PM2.5 causing childhood respiratory and allergic conditions is still conflicting [43, 44]. However, similar to the exposure to NO2, PM2.5 increased the risk for ADHD and Alzheimer’s Disease through chronic brain inflammation pathophysiology [45, 46]. Elevated blood pressure, atherosclerosis, and thrombosis in children through the systemic inflammation pathway are also associated with long exposure to PM, especially PM2.5. Polycyclic aromatic hydrocarbons are a pollutant strongly associated with obesity [47, 48].
Exposure to air pollutants has been linked with respiratory illnesses. A cross-sectional study in several primary schools in Jakarta found a significant relationship between PM2.5 concentration with respiratory symptoms [49]. Another cohort study in Jakarta also revealed that children living in highly polluted areas had higher incidence rates of cough and longer duration compared to those in low polluted areas [50]. Analysis of Disability-Adjusted Life Years (DALY) for 2019 showed that among those under-five, the factors potentially cause a loss of 1,788 DALYs per 100,000 (696.5-3,049.92). As the children's age increase, the risk decreases. As comparison, for those under 20 years old in Jakarta, air pollution is the third highest cause of mortality and morbidity combined, costing 452.46 DALYs per 100,000 (179.28-770.55) [51]. Singh et al. also identified the effect of air pollution exposure on children’s growing stature. Exposure to air pollution in the first trimester is associated with a 6.7% decrease in height-for-age and a 7.8% decrease in weight-for-age in the setting of poor urban cities in India [52]. Exposure to air pollution cannot be separated from the context of its setting. Jakarta, as a metropolitan area, has high exposure to air pollution. This is influenced by heavy traffic and high population density. Other densely populated urban cities in Indonesia, such as Surabaya, Semarang, and Makassar, are also included as cities with poor air quality in Indonesia [53]. Lessons learned from Jakarta can be applied as a reflection to build an effective strategy for other urban cities.
In Indonesia, the incidence rate of respiratory infection among children is still high and is identified as one of the main contributors to child mortality [15]. Cough, cold, and asthma are common symptoms affecting children with lower and upper respiratory infections. Any form of particulate matter can induce a reaction in the upper and lower respiratory tract systems. Children who live in an area with higher PM concentrations are more prone to develop these symptoms [54, 55]. Hence, air quality monitoring in Jakarta is indeed urgently needed to prevent respiratory and infectious diseases among children.
CONCLUSION
JMA has experienced rapid development that may not have adhered to the established regulation of urban planning, causing multiple urban health risk issues, such as high private transportation use, coal-powered plants, lack of green spaces, and industrialization. All of these have contributed to the high level of air pollutants in JMA. However, limited studies existed in framing JMA as a whole region; most studies focused on the core of JMA, the Special Capital Region of Jakarta. Existing data showed that the air pollutants in JMA, specifically PM2.5, SO2, NO2, and CO, are categorized as moderate to high compared to international standards. As shown in several reviews on the potential impact of air pollutants on child health in various pathways, the level of air pollutants in JMA could potentially become a contributing factor to the mortality and morbidity of children living in Jakarta. Even though JMA has more intense levels of air pollution compared to other cities in Indonesia, this analysis can be extrapolated to the urban context of Indonesia in general. More aggressive approaches, i.e., strict regulations, increased awareness among communities, and commitment among industries as well as government, are required to tackle air pollution issues, especially because air pollution has been recognized by the UN General Assembly as one of the most serious risk factors towards health.
LIST OF ABBREVIATIONS
| ADHD | = Attention Deficit Hyperactivity Disorder |
| AQI | = Air Quality Index |
| BC | = Black Carbon CO |
| DALY | = Disability-Adjusted Life Years |
| EOCD | = Organisation for Economic Co-operation and Development |
| JMA | = Jakarta Metropolitan Area |
| O2 | = Oxygen |
| O3 | = Ozone |
| PM | = Particulate Matter |
| SO2 | = Sulfur Dioxide |
| NO2 | = Nitrogen Dioxide |
| UN | = United Nation |
| WHO | = World Health Organization |
CONSENT FOR PUBLICATION
Not applicable.
FUNDING
None.
CONFLICT OF INTEREST
The authors declare no conflict of interest financial or otherwise.
ACKNOWLEDGEMENTS
Declared none.

