All published articles of this journal are available on ScienceDirect.

The Impact of Smartphone Use on Learning Effectiveness: A Case Study of College Students
Authors Info & Affiliations
Abstract
Objective
This study aimed to determine the impact of mobile phone use on the study habits and time management of undergraduate students at a Private University in Nigeria.
Methods
The study employed a quantitative descriptive cross-sectional study design. The study was carried out among 382 students across various colleges and class levels in a private university. Participants were selected using a multistage sampling technique. Data were obtained using a semi-structured pretested questionnaire. A mathematical model was also used to study the effect of specific absorption rates from the phone on the mental concentration level of students.
Results
Findings from this study revealed that more than half (56.0%) of the respondents were between 19 and 23 years old, with a mean age of 20.5±3.2, and a little above average (52.4%) were females. The majority of the respondents (64.9%) spent more than 5 hours on their mobile phones daily. A little above half (57%) of the students had a poor pattern of mobile phone use, while 59% had bad study habits. On the other hand, the majority (73%) of the students had good time management practices. Also, there were significant relationships between mobile phone use and study habits (p=0.001) and study habits and time management (p=0.001), but no significant association existed between mobile phone use and time management (p=0.070) at 95% confidence interval. The model suggests that students’ concentration may be affected by the specific absorption rate from mobile phones, leading to varying levels of distraction.
Conclusion
Conclusively, above half of the students had a bad pattern of mobile phone use and poor study habits; however, the majority of the students had good time management. Hence, undergraduates should be educated about the ill effects of excessive mobile phone use on their physical, mental, and social health and academic performance.
1. INTRODUCTION
Mobile phones are considered an essential part of day-to-day life, and their excessive use is detrimental to the mind and body, especially for the younger population [1, 2]. This device is popular among every age group, especially among college or university students [3, 4]. Millions of students have reported the use of mobile phones during learning and how it has made their lives easier, as they can access their school information on the gadget through electronic learning (e-learning) and mobile learning (m-learning) [5, 6].
For successful education, good study habits are important, and being successful in school requires effective study habits. Study habits directly reflect on one’s learning ability, so students need to understand their own individual habits to improve learning [7]. Mobile phone usage has been reported as one of many factors that influence the study habits of university students. The pattern of use and misuse are insufficiently studied by researchers. Some studies show that the advantages outweigh the disadvantages when it concerns the students [8-10]. The increased use of mobile phones by students has become a significant concern for both parents and lecturers. Parents are very much worried about students’ habitual use of mobile phones, making them abandon their academic work [11]. On the other hand, lecturers complain about it being a distraction to students during lectures [9].
Mobile phones are essential to students; they make learning easy for them, they can carry a whole semester's worth of notes around, and they can easily surf the internet [12]. Furthermore, mobile phones enhance interaction between lecturers and students, making it possible for students to learn from home compared to the face-to-face mode of teaching and learning [13]. A study involving undergraduate students at a University in the United States of America found that students commonly use smartphones for academic purposes, like fetching information from a search engine like Google, gaining access to libraries, online dictionaries, and student portals of their respective universities or colleges [14]. Also, many students use it to connect with social media applications and websites to interact with authors to validate the precision of the given information in their research [15].
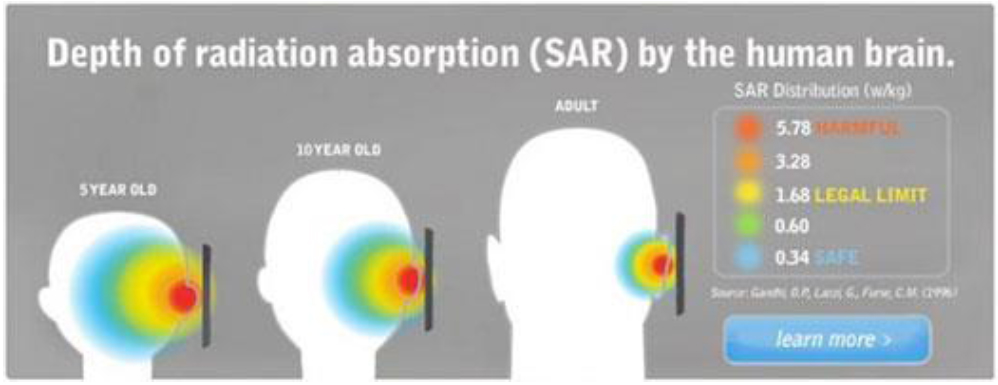
Depth of radiation absorption by the human brain [43].
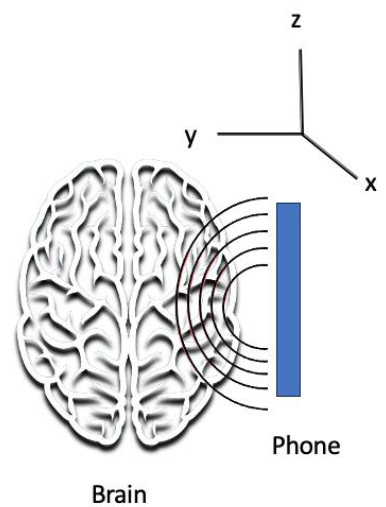
Model structure.
The results of some research have stated that there is a general positive effect of mobile use on the study habits of university students. Reports from a study stated that the respondents were contented with using mobile phones to study; mobile phones assisted them in developing reading habits, and mobile phones also aided their performance in reading [16]. However, another study confirmed that the double effects of mobile phones on the students’ performance and mobile phone addiction lead to bad results [17]. Despite many positive outcomes, excessive mobile phone use is often associated with many disturbing behaviours, as students use phones more than any other social group in Nigeria [18, 19]. A study conducted among university students in southwest Nigeria showed that 98% of the respondents used their phones to communicate with their family and friends, and only 24% used their phones for academic activities [20].
The adverse effects of mobile use on students’ study habits are on the rise, which has become a reason for significant worry for schools and society at large. Obi et al. [21] established in their research that using mobile phones during private study and lectures negatively affects students’ time management, study habits, and concentration during lectures. The study also concluded that if students are not enlightened about the negative effects of mobile phones on their study habits, they will continue to have poor academic performance [22]. Some other studies have also shown that the mobile phone, despite being a means of communication and learning, has several negative impacts on students' lives. Also, the habitual, compulsive, and dependent usage of mobile phones has been noted as a 21st-century non-drug addiction among students [4].
Another angle to this study is the consideration of the health implications for phone users. Mobile phones, in the context of the research, use radiofrequency radiation (RF) to send signals. RF is a possible source of human carcinogens, according to the International Agency for Research on Cancer (IARC). Since the human body absorbs energy from devices that emit radiofrequency radiation, the continuous use of mobile phones for a long duration implies that the body continuously absorbs energy, which may be dangerous in the long term. The terminology for the measurement of the energy absorbed by the body is referred to as specific absorption rate (SAR). International Commission on Non-Ionizing Radiation Protection (ICNIRP) recommended that the limit of SAR in phones should not exceed 2 W/kg. Thus, the effect on the human tissue differs, as presented in Fig. (1A). SAR calculation is averaged over any 6-minute time period. Hence, when a call exceeds 6 minutes, the SAR to the body differs; as such, beyond the SAR, it is important to emphasize the exposure time of the phone during calls and the total absorbed energy by the body (Fig. 1B).
It has earlier been noted that there is a paucity of reports on the study habits of students in universities in Nigeria [22]. As universities keep recycling students concerning different academic sessions and the unpredictable changes in human behaviour, it is imperative to examine the effect of mobile phones on different variables like time management, academic performance, and learning behaviours. This study aimed to determine the influence of mobile phone use on private university students' study habits and time management. The findings from this study provided insight into the current situation regarding university students' study habits, focusing on socioeconomic status, mobile phone use, and time management.
2. METHODS
2.1. Study Design and Study Location
The study employed a quantitative descriptive cross-sectional study design aimed at identifying the individual study habits of Afe Babalola University students and the influence of mobile phone use on study habits. This study was conducted at Afe Babalola University, Ado-Ekiti, Ekiti State, a Federal Government-licensed and non-profit Private University. It is located in the Southwestern part of Nigeria. The University operates a collegiate system and has five such colleges: the College of Medicine and Health Sciences, College of Engineering, College of Law, College of Sciences and Social and Management Sciences, and College of Pharmacy, which was recently added.
2.2. Target Population, Sample Size, and Sampling Techniques
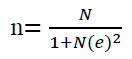
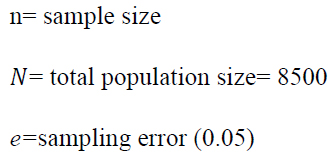
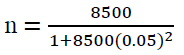
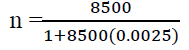
The target population for this study included undergraduate students studying at Afe Babalola University and using mobile phones in their daily work routine, including studying. The sample size for this study was determined using Yamane Taro’s Formula:
 |
(1) |
Where:
 |
 |
 |
 |
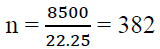 |
From the total population of 8,500 students and sampling error of 0.05, the equivalent minimum sample size was 382 persons. The sampling technique employed in this study was a multistage sampling technique.
2.3. Instrument for Data Collection
The research instrument used for data collection in this study was a semi-structured pre-tested questionnaire including the Socio-economic status Scale (SES) and Study Habit Inventory Scale (SHI). The questionnaire was in five sections: Section A, which consisted of socio-demographic data; Section B, which explored the mobile phone preferences and pattern of mobile phone use of the students of Afe Babalola University; Section C, which determined the study habits of ABUAD students, and Section D which contained questions on the influence of mobile phones on students’ time management.
2.4. Validity and Reliability of Instrument
To ensure validity of the instrument, the questionnaire was constructed after a critical literature review to incorporate and appropriately measure intended variables such as the Socio-economic status Scale (SES) and Study Habit Inventory Scale (SHI) [23-26]. The questionnaire was void of ambiguous questions and was made sure to address all the research problems. The research supervisor and other experts also closely examined and validated the questionnaire to ensure that it was well constructed and no relevant information was omitted. In testing the reliability of the instruments, the Test-retest method was used. The method involves the administration of the same instrument to the same subjects under the same conditions on two or more occasions. The result yielded a Cronbach alpha coefficient of 0.80.
2.5. Method of Data Collection and Data Analysis
The study utilized semi-structured questionnaires, which were constructed and composed in simple, understandable terms. It was distributed among the students of the various colleges. This was done in their hall of residence (hostels) and classrooms during break sessions. Data collected from participants were analyzed using Statistical Package for Social Sciences (SPSS) version 25. Data were summarized and presented using descriptive statistics (tables, frequency charts, and percentages). Inferential statistics were used to test the hypothesis with the level of significance set at p < 0.05. The level of mobile phone use among students was assessed by analyzing related variables under the 'pattern of mobile use' section, such as how often they use their phones for study and during lectures, and by calculating the median score. Scores above the median score were regarded as a good level of usage, while scores below the median score were regarded as poor. The median score was 8.00.
The study habit pattern of the students was assessed by computing the variables under the “study habits” section with Never = 0, Rarely = 1, Sometimes = 2, and Always = 3; coding was reversed for negatively worded questions. The median score was calculated; scores above the median score were regarded as good study habits, while scores below the median score were regarded as poor study habits. The median score was 35.00.
The time management pattern of the students was assessed by computing the variables under the “time management” section with Never = 0, Rarely = 1, Sometimes = 2, and Always = 3; coding was reversed for negatively worded questions. Those who studied for less than 4 hours were coded as 1, while those who studied for more than 4 hours were coded as 2. The median score was calculated, scores above the median score were regarded as good time management, while scores below the median score were regarded as poor time management. The median score was 12.00.
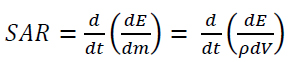
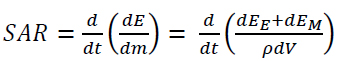
2.6. Specific Absorption Rate Model
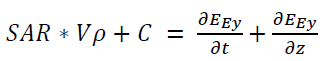
The specific absorption rate (SAR) model is given in Equation (2) below:
 |
(2) |
dE is the incremental energy, dm is the incremental mass, dV is the volume element, and
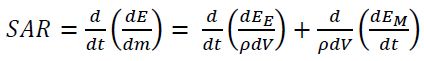
The incremental energy has both electric and magnetic fields associated with it. This energy does not propagate, but it creates reactive and far fields that may be stronger than the radiated fields [44]. This fact expands equation (2) to (3):
 |
(3) |
dEE is the incremental energy due to the electric field and dEM is the incremental energy due to the magnetic field. Equation (2) can be written as:
 |
(4) |
Applying the Maxwell equation,
 |
(5) |
Since  assume that the parameter of ai moves in the direction of
  then the equation is modified in equation (4) and illustrated below:
 |
(6) |
Equation (5) is solved with an initial condition that 
 |
(7) |
2.7. Ethical Approval
Ethical clearance was obtained from the Ethics and Research Committee of the university with a study protocol number (AB/EC/022/02/448). Informed consent was obtained from all subjects and/or their legal guardian(s). Participants were assured that participation in the study was anonymous and all findings from the study would be kept confidential. To ensure confidentiality and anonymity, no form of participants’ identity was required on the questionnaire. Participants were also informed of their right to decide either to participate in the study or back out, even after initially agreeing to participate without any form of penalty. Research procedures followed were in accordance with the ethical standards of the committee responsible for human experimentation and with the Helsinki Declaration of 1975, as revised in 2013.
3. RESULTS
Table 1 presents the socio-demographic characteristics of the respondents; the mean age was 20.5 ± 3.2, with 214 respondents (56.0%) between 19 and 23 years. A little above average (52.4%) were females. More than half (58.1%) of the respondents were in their junior and final year. The family income of 252 respondents (66%) was above average, while 130 (34.0%) had an average family income. More than half, 227 respondents (59.4), got their pocket money every month, while 8 (2.1%) got it daily. About 132 respondents (34.6%) received between 20000-40000 naira (13.15-26.30 USD) as pocket money, 113 (29.3%) received 40000-60000 naira (26.30-39.45 USD), 67 (17.5%) received 60000-80000 naira (39.45-52.59 USD), while 70 (18.3%) received above 80000 naira (52.59USD).
| Variables | Description | Frequency (n=382) | Percentage (%) |
|---|---|---|---|
| Age | Mean±SD = 20.5 ± 3.2 years | 157 | 41.1 |
| 16-18 | 214 | 56 | |
| 19-23 | 11 | 2.7 | |
| 24-28 | |||
| Sex | Male | 182 | 47.6 |
| Female | 200 | 52.4 | |
| Level | 100 | 82 | 21.5 |
| 200 | 78 | 20.4 | |
| 300 | 71 | 18.6 | |
| 400 | 97 | 25.4 | |
| 500 | 54 | 14.1 | |
| College | Engineering | 71 | 18.6 |
| Law | 101 | 26.4 | |
| Medical and health science | 107 | 28 | |
| Sciences | 41 | 10.7 | |
| Social and management science | 62 | 16.2 | |
| Department | Chemical engineering | 12 | 3.1 |
| Civil engineering | 11 | 2.9 | |
| Electrical engineering | 25 | 6.5 | |
| Mechanical engineering | 23 | 6 | |
| Law | 101 | 26.4 | |
| HND | 24 | 6.3 | |
| MBBS | 31 | 8.1 | |
| Nursing | 29 | 7.6 | |
| Pharmacy | 23 | 6 | |
| Agricultural science | 9 | 2.4 | |
| Architecture | 12 | 3.1 | |
| Computer science | 20 | 5.2 | |
| Accounting | 25 | 6.5 | |
| Economics | 23 | 6 | |
| International relations | 14 | 3.7 | |
| How much do you receive as monthly allowance? | 10,000-50,000 | 206 | 53.9 |
| 51,000-100,000 | 124 | 32.5 | |
| 101,000-150,000 | 20 | 5.2 | |
| 151,000-200,000 | 14 | 3.7 | |
| Above 200,000 | 18 | 4.7 | |
| How would you best describe your family economic status? | Average | 130 | 34 |
| Above average | 252 | 66 | |
| How do you receive your allowance? | Daily | 8 | 2.1 |
| Weekly | 85 | 22.3 | |
| Monthly | 227 | 59.4 | |
| Whenever you need money | 62 | 16.2 | |
| How much do you receive as pocket money | 20000-40000 | 132 | 34.6 |
| 40000-60000 | 113 | 29.6 | |
| 60000-80000 | 67 | 17.5 | |
| Above 80000 | 70 | 18.3 | |
| Father’s level of education | Primary | 2 | 0.5 |
| Secondary | 3 | 0.8 | |
| Tertiary | 22 | 5.8 | |
| BSc | 55 | 14.4 | |
| Master’s | 150 | 39.3 | |
| Ph.D. | 150 | 39.3 | |
| Mother’s level of education | Primary | 4 | 1 |
| Secondary | 15 | 3.9 | |
| Tertiary | 41 | 10.7 | |
| BSc | 104 | 27.2 | |
| Master’s | 137 | 35.9 | |
| Ph.D. | 81 | 21.2 | |
| Father’s nature of job | Blue-collar jobs | 24 | 6.3 |
| White-collar jobs | 209 | 54.7 | |
| Self-employed | 137 | 35.9 | |
| Unemployed | 6 | 1.6 | |
| Others | 6 | 1.6 | |
| Mother’s nature of job | Blue-collar jobs | 12 | 3.1 |
| White-collar jobs | 179 | 46.9 | |
| Self-employed | 183 | 47.9 | |
| Unemployed | 2 | 0.5 |
| Variables | Description | Frequency (n=382) | Percentage (%) |
|---|---|---|---|
| What type of phone do you use? | IPhone | 155 | 40.6 |
| Techno | 41 | 10.7 | |
| Samsung | 106 | 27.7 | |
| Nokia | 4 | 1 | |
| Gionee | 7 | 1.8 | |
| Another brand | 69 | 18.1 | |
| Does your phone have access to the internet | Yes | 382 | 100 |
| No | 0 | 0 | |
| What activities do you use your phone for? | Texting | 382 | 100 |
| Calls | 382 | 100 | |
| Watch movies | 350 | 91.6 | |
| Play games | 317 | 83 | |
| Listen to music | 367 | 96.1 | |
| Surfing the web | 382 | 100 | |
| Reading | 338 | 88.5 | |
| As an alarm | 349 | 91.4 | |
| Radio | 218 | 57.1 | |
| Calendar | 200 | 52.4 | |
| Taking pictures | 382 | 100 | |
| As a calculator | 323 | 84.6 | |
| Do you use your phone during lectures | Never | 41 | 10.7 |
| Rarely | 107 | 28 | |
| Sometimes | 207 | 54.2 | |
| Always | 27 | 7.1 | |
| Do you use your phone while studying | Yes | 358 | 93.7 |
| No | 24 | 6.3 | |
| How often do you use your phone when studying | Never | 5 | 1.3 |
| Rarely | 55 | 14.4 | |
| Sometimes | 265 | 69.4 | |
| Always | 57 | 14.9 | |
| When studying, what do you use your phone for? | Assess lecture notes | 355 | 92.9 |
| Browsing the internet | 328 | 85.9 | |
| Assessing online articles | 278 | 72.8 | |
| Listen to music | 298 | 78 | |
| Responding to text messages | 259 | 67.8 | |
| Checking Whatsapp status | 302 | 79.1 | |
| Do you perform most of your studying with your phone? | Yes | 122 | 31.9 |
| No | 260 | 68.1 |
The majority of the respondents, 155 (40.6%), used iPhone, 41 (10.7%) used Tecno, 106 (27.7%) used Samsung, 4 (1.0%) used Nokia, 7 (1.8%) used Gionee, while 69 (18.1%) used other brands. All the respondents’ phones had internet access. More than half, 207 (54.2%), used their phones ‘sometimes’ during lectures, 107 (28.0%) used their phones ‘rarely’ during lectures, 41 (10.7%) ‘Never’ used their phones during lectures, while 27 (7.1%) ‘Always’ used the phones during lectures. The majority of the respondents, 358 (93.7%), used their phones while studying, while 24 (6.3%) did not use their phones while studying. Of the respondents, 122 (31.9%) performed most of their studying with their phones, while 260 (68.1%) did not study with their phones (Table 2).
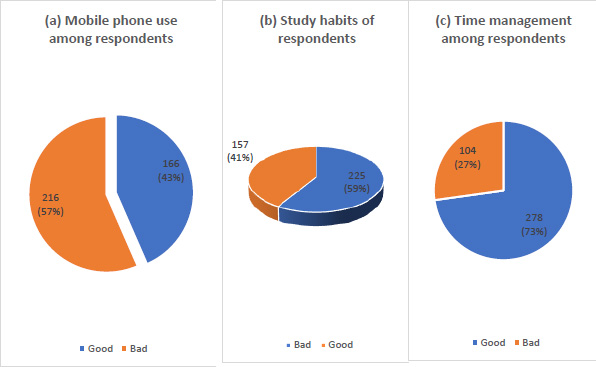
As shown in Fig. (2), the majority of the respondents, 280 (73%), had bad mobile phone use, as most used the phone for non-study purposes, while only 102 (27%) had good mobile phone use.
About 106 respondents (27.7%) ‘never’ went to the college/library to study; 68 (17.8%) rarely went, 152 (39.8%) sometimes went, and 56 (14.7%) always went. A total of 176 (46.1%) read in their rooms sometimes, 122 (31.9%) always read in their rooms, 78 (20.4%) rarely read in their rooms, and 6 (1.6%) never read in the room. The majority, 268 (70.2%), read alone sometimes, 65 (17.0%) always read alone, 40 (10.5%) rarely read alone, and 9 (2.4%) never read alone. A total of 206 (53.9%) respondents sometimes assimilated more when they read in groups, 81 (21.2%) always assimilated more when they read in a group, 52 (13.6%) rarely assimilated more when they read in the group while 43 (11.3%) never assimilated more when they read in groups. A total of 152 (39.8%) sometimes read with music, 132 (34.6%) rarely read with music, 76 (19.9%) never read with music, and 22 (5.8%) always read with music (Table 3). Over half, 214 (56%) respondents had bad study habits, while 168 (44%) had good study habits (Fig. 2).
Mobile phone use rate, study habits, time management habits of respondents.
| Variables | Never | Rarely | Sometimes | Always |
|---|---|---|---|---|
| Do you go to the college/library when you want to study? | 106 (27.7%) | 68 (17.8%) | 152 (39.8%) | 56 (14.7%) |
| Do you stay in your room to read? | 6 (1.6%) | 78 (20.4%) | 176 (46.1%) | 122 (31.9%) |
| Do you read alone? | 9 (2.4%) | 40 (10.5%) | 268 (70.2%) | 65 (17.0%) |
| Do you read in a group? | 48 (12.6%) | 94 (24.6%) | 192 (50.3%) | 48 (12.6%) |
| Does reading in groups help in assimilate more? | 43 (11.3%) | 52 (13.6%) | 206 (53.9%) | 81 (21.2%) |
| Do you read in a completely quiet environment? | 19 (5.0%) | 75 (19.6%) | 151 (39.5%) | 137 (35.9%) |
| How often do you read with music? | 76 (19.9%) | 132 (34.6%) | 152 (39.8%) | 22 (5.8%) |
| How often do you use printouts/handwritten notes to read? | 25 (6.5%) | 0 (0.0%) | 222 (58.1%) | 135 (35.3%) |
| Do you take down notes while reading? | 12 (3.1%) | 35 (9.2%) | 139 (36.4%) | 196 (51.3%) |
| Do you time yourself when reading? | 122 (31.9%) | 85 (22.3%) | 136 (35.6%) | 39 (10.2%) |
| Do you read books with colors and diagrams? | 59 (15.4%) | 166 (43.5%) | 139 (36.4%) | 18 (4.7%) |
| Do you gist with friends when reading? | 39 (10.2%) | 123 (32.2%) | 216 (56.5%) | 4 (1.0%) |
| Do you chat while reading? | 72 (18.8%) | 108 (28.3%) | 189 (49.5%) | 13 (3.4%) |
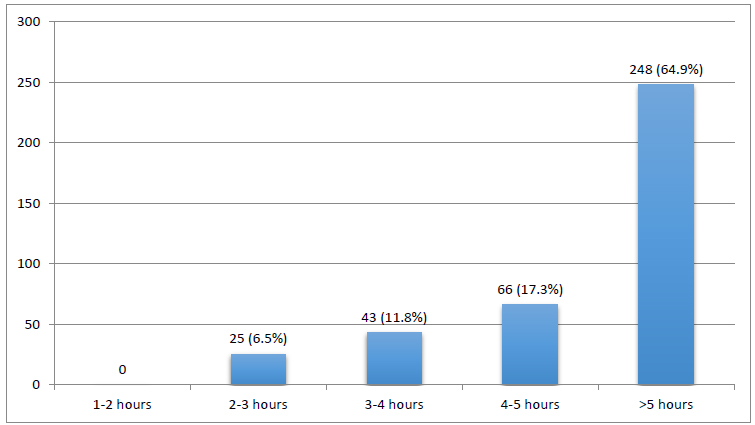
A higher percentage (46.1%) of the respondents suffered from lack of sleep ‘sometimes’ because of late-night mobile phone use; 99 (25.9%) rarely suffered from lack of sleep, while 31 (8.1%) always suffered from lack of sleep. A total of 161 (42.1%) respondents used their phone sometimes until late at night, which affected their punctuality in attending lectures, while 128 had never used their phone till late at night. A total of 174 (45.5%) respondents sometimes got distracted by different notifications when using their phones to read, 99 (25.9%) rarely got distracted, 90 (23.6%) always got distracted, and 19 (5.0%) never got distracted (Table 4). The majority (73%) of the respondents had good time management habits, while 27% had bad study habits (Fig. 2). Most of the respondents, 248 (64.9%), spent more than 5 hours of their time daily on mobile phones, 66 (17.3%) spent 4-5 hours, 43 (11.8%) spent 3-4 hours, 25 (6.5%) spent 2-3 hours, and none of the respondents spent 1-2 hours (Fig. 3).
As presented in Table 5, there is no significant relationship between time management and mobile phone use of respondents (p = 0.070), there is a significant relationship between time management and study habits of respondents (p = 0.001), and there is a significant relationship between the mobile phone use and study habits (p = 0.001).
Family income (p < 0.0001), the pattern of allowance (p < 0.0001), amount of allowance (p < 0.0001), fathers and mothers’ level of education (p < 0.0001), fathers’ nature of job (p = 0.030), and mothers’ nature of job (p < 0.0001) were significantly related to study habits, while age (p = 0.603) was not significantly related to study habits (Table 6). As presented in Table 7, college (p < 0.0001), family income (p < 0.0001), the pattern of allowance (p= 0.020), amount of allowance (p < 0.0001), fathers and mothers’ level of education (p < 0.0001), father’s nature of job (p < 0.0001) and mothers’ nature of job (p < 0.0001) were significantly related to mobile phone use, while age (p = 0.457), gender (p = 0.547) and level (p = 0.589) were not significantly related to mobile phone use.
Furthermore, College (p = 0.019), amount of allowance (p < 0.0001), fathers’ level of education (p < 0.0001), and father’s nature of job (p = 0.011) were significantly related to time management, while age (p = 0.512), gender (p = 0.739), level (p = 0.698) family income (p = 0.073), the pattern of allowance (p= 0.444), mothers’ level of education (p = 0.163) and mothers’ nature of job (p =0.070) were not significantly related to time management (Table 8).
The simulation of the incremental energy received from the phone to the human brain at a safe specific absorption rate limit of 2 W/kg is presented in Fig. (4). Even at a safe limit, the distribution of energy from the ear to the brain is important. When the students are exposed to the phone for one minute, it is expected that the energy reaching the brain (Eb) is diffused by the skull and other tissues, as seen in Fig. (4a). The energy dissipated at the entry point (Ea) spreads across the ear, cheeks, and upper head. When the students are exposed to the phone in a five-minute phone call, as shown in Fig. (4b), Ea is expected to become narrower, with about 4.5 J energy dissipating. Its effect in Eb lightly becomes concentrated. When the students are exposed to the phone in a ten-minute phone call, as shown in Fig. (4c), Ea is expected to become narrower (covering the pinnae), with about 8 J energy dissipating. Its effect in Eb lightly becomes more concentrated. When the students are exposed to a phone call lasting more than 20 minutes, as shown in Fig. (4d), Ea is expected to become narrower (covering the auditory canal), with > 14 J dissipating through less tissues or skin to absorb the energy.
| Variables | Never | Rarely | Sometimes | Always |
|---|---|---|---|---|
| Suffered from sleep loss as a result of late-night mobile phone use | 76 (19.9%) | 99 (25.9%) | 176 (46.1%) | 31 (8.1%) |
| Does using phone until late at night affect your attendance/punctuality to lectures? | 128 (33.5%) | 86 (22.5%) | 161 (42.1%) | 7 (1.8%) |
| Lost track of time while using your phone? | 29 (7.6%) | 110 (28.5%) | 197 (51.6%) | 46 (12.0%) |
| Do you get distracted by different notifications when using your phone to read? | 19 (5.0%) | 99 (25.9%) | 174 (45.5%) | 90 (23.6%) |
| How often do you postpone your studying because you want to use your phone? | 123 (32.2%) | 150 (39.3%) | 102 (26.7%) | 7 (1.8%) |
Influence of mobile phone use on respondent’s time management.
| Chi-square result of relationship between mobile phone use and time management | ||||||||
|---|---|---|---|---|---|---|---|---|
| Level of Time Management | Total | X2 | Df | p-value | ||||
| Bad | Good | |||||||
| Level of mobile phone use | Good | 53 | 113 | 166 | 3.277 | 1 | 0.070 | |
| Bad | 51 | 165 | 216 | |||||
| Total | 104 | 278 | 382 | |||||
| Chi-square result of relationship between Study habit and time management | ||||||||
| Level of time management | Total | X2 | Df | P-value | ||||
| Bad | Good | |||||||
| Level of Study habit | Bad | 76 | 149 | 225 | 11.864 | 1 | 0.001 | |
| Good | 28 | 129 | 157 | |||||
| Total | 104 | 278 | 382 | |||||
| Chi-square result of relationship between mobile phone use and study habits of students | ||||||||
| Mobile Phone Use | Total | X2 | Df | P-value | ||||
| Good | Bad | |||||||
| Level of Study habit | Good | 59 | 109 | 168 | 10.857 | 1 | 0.001 | |
| Bad | 43 | 171 | 214 | |||||
| Total | 102 | 280 | 382 | |||||
| - | Level of Study habit | Total | X2 | Df | p-value | ||
|---|---|---|---|---|---|---|---|
| Bad | Good | ||||||
| Age | 14-18 | 95 | 62 | 157 | 1.011 | 2 | 0.603 |
| 19-23 | 125 | 89 | 214 | ||||
| 24-28 | 5 | 6 | 11 | ||||
| Sex | Male | 90 | 92 | 182 | 4.224 | 1 | 0.040 |
| Female | 78 | 122 | 200 | ||||
| Level | 100 | 39 | 43 | 82 | 1.512 | 4 | 0.825 |
| 200 | 31 | 47 | 78 | ||||
| 300 | 29 | 42 | 71 | ||||
| 400 | 45 | 52 | 97 | ||||
| 500 | 24 | 30 | 54 | ||||
| College | Engineering | 34 | 37 | 71 | 1.547 | 4 | 0.818 |
| Law | 41 | 60 | 101 | ||||
| MHS | 46 | 61 | 107 | ||||
| Sciences | 17 | 24 | 41 | ||||
| SMS | 30 | 32 | 62 | ||||
| How will you best describe your family economic status? | Average | 59 | 71 | 130 | 14.871 | 1 | 0.000* |
| Above average | 166 | 86 | 252 | ||||
| How do you receive your allowance? | Daily | 1 | 7 | 8 | 37.912 | 3 | 0.000* |
| Weekly | 72 | 13 | 85 | ||||
| Monthly | 125 | 102 | 227 | ||||
| whenever you need money | 27 | 35 | 62 | ||||
| how much do you receive as pocket money? | 20000-40000 | 88 | 44 | 132 | 24.380 | 3 | 0.000* |
| 40000-60000 | 57 | 56 | 113 | ||||
| 60000-80000 | 27 | 40 | 67 | ||||
| Above 80000 | 53 | 17 | 70 | ||||
| Father’s level of education | Primary | 2 | 0 | 2 | 30.213 | 5 | 0.000* |
| Secondary | 1 | 2 | 3 | ||||
| Tertiary | 12 | 10 | 22 | ||||
| BSc | 16 | 39 | 55 | ||||
| Master's | 89 | 61 | 150 | ||||
| Ph.D | 105 | 45 | 150 | ||||
| Mother’s level of education | Primary | 2 | 2 | 4 | 24.747 | 5 | 0.000* |
| Secondary | 6 | 9 | 15 | ||||
| Tertiary | 12 | 29 | 41 | ||||
| BSc | 58 | 46 | 104 | ||||
| Master's | 95 | 42 | 137 | ||||
| Ph.D | 52 | 29 | 81 | ||||
| Father’s nature of job | Blue-collar jobs | 15 | 9 | 24 | 10.693 | 4 | 0.030* |
| White-collar jobs | 124 | 85 | 209 | ||||
| self-employed | 84 | 53 | 137 | ||||
| Unemployed | 2 | 4 | 6 | ||||
| Others | 0 | 6 | 6 | ||||
| Mother’s nature of job | Blue-collar jobs | 6 | 6 | 12 | 27.556 | 4 | 0.000* |
| white-collar jobs | 88 | 91 | 179 | ||||
| self-employed | 129 | 54 | 183 | ||||
| Unemployed | 2 | 0 | 2 | ||||
| Others | 0 | 6 | 6 | ||||
| - | Level of Mobile Phone Use | Total | X2 | Df | p-value | ||
|---|---|---|---|---|---|---|---|
| Good | Bad | ||||||
| Age | 14-18 | 74 | 83 | 157 | 1.564 | 2 | 0.457 |
| 19-23 | 88 | 126 | 214 | ||||
| 24-28 | 4 | 7 | 11 | ||||
| Sex | Male | 82 | 100 | 182 | 0.362 | 1 | 0.547 |
| Female | 84 | 116 | 200 | ||||
| College | Engineering | 28 | 43 | 71 | 21.307 | 4 | 0.000* |
| Law | 59 | 42 | 101 | ||||
| MHS | 33 | 74 | 107 | ||||
| Sciences | 13 | 28 | 41 | ||||
| SMS | 33 | 29 | 62 | ||||
| Level | 100 | 40 | 42 | 82 | 2.815 | 4 | 0.589 |
| 200 | 34 | 44 | 78 | ||||
| 300 | 33 | 38 | 71 | ||||
| 400 | 36 | 61 | 97 | ||||
| 500 | 23 | 31 | 54 | ||||
| How will you best describe your family economic status | Average | 73 | 57 | 130 | 12.932 | 1 | 0.000* |
| Above average | 93 | 159 | 252 | ||||
| How do you receive your allowance? | Daily | 1 | 7 | 8 | 9.851 | 3 | 0.020* |
| Weekly | 44 | 41 | 85 | ||||
| Monthly | 102 | 125 | 227 | ||||
| Whenever you need money | 19 | 43 | 62 | ||||
| How much do you receive as pocket money? | 20000-40000 | 49 | 83 | 132 | 16.640 | 3 | 0.001* |
| 40000-60000 | 46 | 67 | 113 | ||||
| 60000-80000 | 44 | 23 | 67 | ||||
| Above 80000 | 27 | 43 | 70 | ||||
| Father’s level of education | Primary | 0 | 2 | 2 | 53.524 | 5 | 0.000* |
| Secondary | 0 | 3 | 3 | ||||
| Tertiary | 16 | 6 | 22 | ||||
| BSc | 45 | 10 | 55 | ||||
| Master's | 50 | 100 | 150 | ||||
| Ph.D | 55 | 95 | 150 | ||||
| Mother’s level of education | Primary | 0 | 4 | 4 | 39.919 | 5 | 0.000* |
| Secondary | 13 | 2 | 15 | ||||
| Tertiary | 31 | 10 | 41 | ||||
| BSc | 45 | 59 | 104 | ||||
| Master's | 43 | 94 | 137 | ||||
| Ph.D | 34 | 47 | 81 | ||||
| Father’s nature of job | Blue-collar jobs | 7 | 17 | 24 | 30.804 | 4 | 0.000* |
| White-collar jobs | 110 | 99 | 209 | ||||
| Self-employed | 39 | 98 | 137 | ||||
| Unemployed | 4 | 2 | 6 | ||||
| Others | 6 | 0 | 6 | ||||
| Mother’s nature of job | Blue-collar jobs | 4 | 8 | 12 | 27.606 | 4 | 0.000* |
| White-collar jobs | 97 | 82 | 179 | ||||
| Self-employed | 59 | 124 | 183 | ||||
| Unemployed | 0 | 2 | 2 | ||||
| Others | 6 | 0 | 6 | ||||
| - | Level of Time Management | Total | X2 | Df | p-value | ||
|---|---|---|---|---|---|---|---|
| Bad | Good | ||||||
| Age (in years) | 14-18 | 50 | 107 | 157 | 3.766 | 2 | 0.152 |
| 19-23 | 50 | 164 | 214 | ||||
| 24-28 | 4 | 7 | 11 | ||||
| Sex | Male | 51 | 131 | 182 | 0.111 | 1 | 0.739 |
| Female | 53 | 147 | 200 | ||||
| College | Engineering | 16 | 55 | 71 | 11.768 | 4 | 0.019* |
| Law | 33 | 68 | 101 | ||||
| MHS | 20 | 87 | 107 | ||||
| Sciences | 10 | 31 | 41 | ||||
| SMS | 25 | 37 | 62 | ||||
| Level | 100 | 21 | 61 | 82 | 2.206 | 4 | 0.698 |
| 200 | 25 | 53 | 78 | ||||
| 300 | 17 | 54 | 71 | ||||
| 400 | 24 | 73 | 97 | ||||
| 500 | 17 | 37 | 54 | ||||
| How will you best describe your family economic status? | Average | 28 | 102 | 130 | 3.216 | 1 | 0.073 |
| Above average | 76 | 176 | 252 | ||||
| How do you receive your allowance? | Daily | 1 | 7 | 8 | 2.677 | 3 | 0.444 |
| Weekly | 21 | 64 | 85 | ||||
| Monthly | 68 | 159 | 227 | ||||
| Whenever I need money | 14 | 48 | 62 | ||||
| How much do you receive as pocket money? | 20000-40000 | 30 | 102 | 132 | 22.610 | 3 | 0.000* |
| 40000-60000 | 19 | 94 | 113 | ||||
| 60000-80000 | 22 | 45 | 67 | ||||
| Above 80000 | 33 | 37 | 70 | ||||
| Father’s level of education | Primary | 0 | 2 | 2 | 28.997 | 5 | 0.000* |
| Secondary | 0 | 3 | 3 | ||||
| Tertiary | 0 | 22 | 22 | ||||
| BSc | 24 | 31 | 55 | ||||
| Master's | 27 | 123 | 150 | ||||
| Ph.D | 53 | 97 | 150 | ||||
| Mother’s level of education | Primary | 2 | 2 | 4 | 7.879 | 5 | 0.163 |
| Secondary | 3 | 12 | 15 | ||||
| Tertiary | 7 | 34 | 41 | ||||
| BSc | 37 | 67 | 104 | ||||
| Master's | 36 | 101 | 137 | ||||
| Ph.D | 19 | 62 | 81 | ||||
| Father’s nature of job | Blue-collar jobs | 2 | 22 | 24 | 13.028 | 4 | 0.011* |
| White-collar jobs | 69 | 140 | 209 | ||||
| Self-employed | 33 | 104 | 137 | ||||
| Unemployed | 0 | 6 | 6 | ||||
| Others | 0 | 6 | 6 | ||||
| Mother’s nature of job | Blue-collar jobs | 2 | 10 | 12 | 8.658 | 4 | 0.070 |
| White-collar jobs | 52 | 127 | 179 | ||||
| Self-employed | 48 | 135 | 183 | ||||
| Unemployed | 2 | 0 | 2 | ||||
| Others | 0 | 6 | 6 | ||||
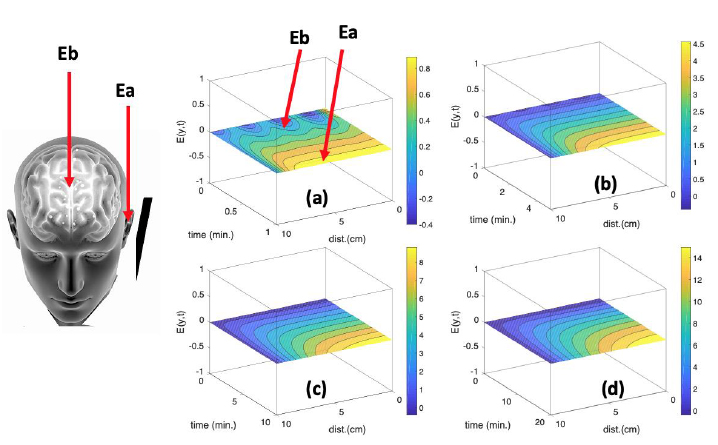
Incremental energy received from the phone to the human brain at a safe specific absorption rate limit of 2 W/kg (a) time of 1 minute (b) time of 5 minutes (c) time of 10 minutes (d) time of 20 minutes.
4. DISCUSSION
In this study, above half of the respondents had bad mobile phone use (57%) and study habits (59%), which is quite worrisome. The bad study habits of the students may be traceable to their bad mobile phone use because most of the students agreed to be distracted with their mobile phones as they use them for other non-academic purposes during lectures and their reading time. This is in tandem with similar previous studies where bad mobile phone use was reported to negatively affect the study habits of students [22, 27]. Also, the fact that a statistically significant relationship between mobile phone use and study habits was reported in this study further affirms the claim. This is consistent with findings from studies conducted among university students in Kogi State, Nigeria, and Kenya [11,28]. Furthermore, it was confirmed in this study that student habits are statistically dependent on time management, which indicates that students who manage their time well are likely to have good study habits. This is in tandem with previous reports [29-31].
As statistically shown in this study, the age, gender, college, and class level of students make no difference in relation to their study habits. Concerning age, this study is in tandem with a study in Ghana that reported no significant association between age and study habits (that confirmed a significant relationship between gender and study habits) but disagrees with other findings that stated otherwise [32, 33]. This may be because all the students in this study were adolescents and youth who were exposed to identical or similar distractions and challenges. In relation to gender, findings from this study agree with previous studies in Zimbabwe and Ghana that confirmed that there was no significant relationship between gender and study habits, but contrary to other similar studies, which proved that female students have better study habits than male students [25, 34-37]. Also, this study noted that class level has no significant relationship with the study habits of students. This disagrees with the report of Khurshid et al., which reported that students at higher class levels had better study habits than those at lower class levels [38].
All the students in this study were from at least an average family economic status, as the majority (66%) were from high-income families. This could be attributed to the fact that the study was conducted at a private university, which suggests that primarily, students from high-income families would be able to afford such an institution.
Interestingly, in this study, there was a statistically significant relationship between socio-economic status and study habits of the students. Similar studies conducted among public school students in India proved otherwise, as socio-economic status was independent of students’ study habits [39, 40]. However, another study among government college students in India agrees with this study's finding that a statistically significant relationship existed between students’ socioeconomic status and study habits [25]. Also, this study found a significant relationship between family economic status and mobile phone use. As earlier noted, the majority of the students had high family economic status; this may also account for the reason why all students could afford and own multi-media mobile phones, which inadvertently influenced mobile phone use among the students.
For the socio-demographic characteristics of the students in this study, only the college they attended had a statistically significant relationship with mobile phone use and time management, while age, sex, and class level did not. It can be suggested that the college of study of students is significantly related to their mobile phone use and time management because the majority of participants were students from the College of Medical Health Sciences and Law. Students from these two colleges (medical health science and law) are noted to have more academic demands and are likely to use their mobile phones to manage assignments, while also demonstrating greater discipline in managing their time.”
Moreover, the majority (63.9%) of the students in this study spent over five hours on the phone daily. This report is similar to a study in Northern Cyprus among private university students, where the majority (84%) also spent over four hours on their phones daily [12]. This may be due to the steady power supply and free access to internet services that students enjoy in private universities, like the one in this study, as they have various activities to engage in on a regularly charged mobile phone connected to stable internet. However, the majority (73%) had good time management skills.
On the other hand, this study found no statistically significant relationship between mobile phone use and time management, indicating that students who have good mobile phone usage may not have a good use of their time and vice versa. This may be because students at private universities, as in the case of this study, are exposed to regimented campus experience with measures to curb excessive social engagements that are perceived to waste students’ time. This disagrees with students’ previous report that identified that phone use is significantly associated with university students' time management [41].
Lastly, it was postulated that the amount of energy reaching the brain of the student during prolonged phone use is technically not harmful but has the tendency to destabilize the student’s concentration when switching to reading hardcopy notes (Fig. 4). More so, increasing the use of cell phones has potential effects on the brain depending on the types of phones and the radiofrequency (RF) radiation they emit. While this radiation has lower energy than ionizing radiation (such as X-rays), with over 14J of energy dissipating to the human skull, concerns exist about whether long-term exposure to RF radiation could increase the risk of brain tumors or other health problems. Mead [42-45] reported that the use of cell phones could cause brain cancer, but our research shows that this effect may only occur in the long term. However, this research believes that the cognitive effects, i.e., difficulty focusing, disrupted sleep due to the blue light emitted from screens, and increased distractibility, are very significant. The psychological effects, including addiction and depression, are secondary concerns regarding the impact of phones on the human brain.
CONCLUSION
In conclusion, undergraduates in this study exhibited poor patterns of mobile phone use and poor study habits, although most of the students had good time management. Hence, undergraduates should be educated about the ill effects of excessive mobile phone use on their physical, mental, and social health, as well as their academic performance. As noted in this study, undergraduates majorly use their phones for assignments and information. This increases the time spent on their phone and ultimately affects their study habits and health. We, therefore, recommend that undergraduates should be encouraged to utilize the university libraries more frequently for published books, thereby reducing time spent on their mobile phone screens.
LIMITATIONS OF STUDY
The study population for this study was limited to students at a private university, which depicts that findings from this study may not be generalizable to public universities in Nigeria. However, the pattern of mobile phone usage observed in this study may be typical of private universities in Nigeria due to similarities in their settings.
AUTHORS’ CONTRIBUTIONS
D.E.: Contributed to the study conception and design, data collection, draft manuscript preparation, and manuscript revision; D.O.: responsible for the analysis and interpretation of results, as well as drafting the manuscript; I.A.: handled data collection and drafted the manuscript; M.E.: Involved in the analysis and interpretation of results, drafting the manuscript, and revising it. A.D.: Contributed to drafting the manuscript. C.G.R: assisted with editing and manuscript revision, as well as project administration; T.O.E: Contributed to drafting the manuscript and revising it; All authors reviewed the results and approved the final version of the manuscript.
LIST OF ABBREVIATIONS
| RF | = Radio Frequency |
| IARC | = International Agency Research on Cancer |
| ICNIRP | = International Commission Non-Ionizing Radiation Protection |
| SES | = Socio-economic Status Scale |
| SPSS | = Statistical Package Social Sciences |
ETHICS APPROVAL AND CONSENT TO PARTICIPATE
Ethical clearance was obtained from the Ethics and Research Committee of the Afe Babalola University, Nigeria with a study protocol number (AB/EC/022/02/448).
HUMAN AND ANIMAL RIGHTS
All procedures performed in studies involving human participants were in accordance with the ethical standards of institutional and/or research committee and with the 1975 Declaration of Helsinki, as revised in 2013.
CONSENT FOR PUBLICATION
Informed consent was obtained from all subjects and/or their legal guardian(s).
AVAILABILITY OF DATA AND MATERIAL
The datasets used for the current study are available from the corresponding author [D.E] upon reasonable request.
ACKNOWLEDGEMENTS
Declared none.

