All published articles of this journal are available on ScienceDirect.

Trends and Factors associated with Stunting and Underweight among Early Grade Learners in Low-Quintile Schools in Johannesburg, South Africa (2020–2022)
Authors Info & Affiliations
Abstract
Background
Although South Africa has made progress in reducing child undernutrition over the last three decades, most data are aggregated at national or provincial levels and are focused on children under five. Limited attention has been given to early grade learners (ages 5–9), particularly in low-income urban settings. This study examines trends and determinants of stunting and underweight among early-grade learners in low-quintile schools in Johannesburg from 2020 to 2022.
Methods
A longitudinal study design of the Community of Practice (CoP) for Child Wellbeing was employed. Data were collected over three waves on a matched sample of 129 learners across the selected five no-fee primary schools in Johannesburg. Anthropometric measurements were used to assess stunting and underweight. Data were analyzed at three levels: univariate, bivariate, and multivariate. The Chi-square test of association and multivariable logistic regression analysis were conducted to identify predictors of nutritional outcomes.
Results
The prevalence of stunting declined from 14% in 2020 to 10% in 2022, while the prevalence of underweight rose from 6% to 12%. Male learners were significantly more likely than females to be both stunted (aOR=3.41, 95% CI: 1.00–11.56) and underweight (aOR=5.08, 95% CI: 1.04–24.70). High levels of caregiver depression (70.54%) and food insecurity were observed but not significantly associated with child nutrition status in adjusted models.
Discussion
This study demonstrates that while progress has been made in reducing stunting among early grade learners, rising underweight rates, especially among boys, signal new forms of acute vulnerability linked to household food insecurity and COVID-19–related shocks.
Conclusion
The rising trend in underweight, particularly among boys, signals increasing acute nutritional vulnerability among early grade learners in urban low-quintile schools. Despite some gains in reducing stunting, current interventions do not adequately address children’s nutritional needs.
1. INTRODUCTION
Childhood malnutrition is a global public health concern due to its potential threat to children’s physical growth and cognitive development [1, 2]. Low-income countries such as those in South and East Asia, as well as countries in the Sub-Saharan Region, are particularly negatively affected by this public health challenge, with nearly 148 million children who are stunted [3]. Early childhood shapes the child’s development, as it provides the window of opportunity for a child’s future well-being and learning [4]. Sustainable Development Goal 2 (SDG2), target 2.2, aims to eliminate all forms of malnutrition by 2025. However, given current global statistics on child malnutrition, this goal is unlikely to be achieved by the end of 2025. This prediction is even true for developing countries such as South Africa, which still grapples with inequality and is burdened by high poverty and unemployment rates [5-7]. Households in low-income settings are sinking deeper into poverty and are increasingly unable to meet their basic needs [8, 9]. In fact, the recent economic shock of the COVID-19 pandemic has exacerbated this situation, resulting in job losses for many households, reduced income, and increased household food insecurity [10-13].
In South Africa, there has been significant progress in improving children’s nutritional outcomes. This progress has translated into programmes and policies aimed at improving child health and nutrition outcomes as well as supporting children’s parents or caregivers in providing childcare. These programmes include social protection programmes such as the CSG for children under 18, which serve as protective factors against poverty and food insecurity for children and their families [14-16]. Programmes such as the introduction of the Integrated School Nutrition Programme (ISNP) in schools were intended to improve nutritional outcomes among schoolchildren [17]. In South Africa, studies have found that introducing school meals helped improve children’s nutritional outcomes. A study in the vulnerable community of Alexandra, South Africa, found that the lunch meal, in addition to the provided school breakfast, reduced stunting and obesity among primary school children [18].
Despite these improvements, stunting is on the rise, and this situation has been the case for over three decades, with approximately 27% of children stunted and 5.9 underweight [19-21]. Among children in early grades, ages five to nine, malnutrition is a direct cause of inadequate nutritional intake from food, which causes infections and can increase illnesses, underweight, and anaemia [22]. These adverse health outcomes can impact school attendance and classroom participation, and can lead to grade repetition [23].
Investing in the early years of the child’s nutrition is critical to improve future economic growth [24]. Although South Africa has national nutrition surveillance systems, such as the National School Nutrition Programme (NSNP) and the National Food and Nutrition Security Survey (NFNSS), the data collected are still largely aggregated at national and provincial levels [25, 26]. This higher-level data makes it difficult to respond to the local needs and implement interventions for children in early grades [27]. In South Africa, many studies on childhood malnutrition have focused on children under five, thus overlooking children in early grades who are still vulnerable and nutritionally at risk [21, 28, 29]. Often, these children fall through the cracks and do not receive the services they need to meet their developmental and nutritional needs [27].
Additionally, there is a paucity of longitudinal studies that track children’s nutritional outcomes post-COVID-19 (2020-2022), particularly in low-income and marginalized urban communities. This study examined trends and factors in stunting and underweight among early-grade learners in low-quintile Johannesburg schools from 2020 to 2022. The findings aim to provide localized, age-specific evidence to inform school-based health and nutrition interventions, guide intersectoral collaboration, and strengthen public policy responses targeting child well-being in low-income urban contexts.
2. METHODS AND DATA
2.1. Study Context
The study was conducted in five schools located in the poorest wards of the Johannesburg municipality (Meadowlands, Doornkop, Alexandra, Malvern, and Ivory Park). These areas are characterized by high poverty and unemployment rates. The low-quintile schools, as defined by the South African Department of Basic Education (DBE), are no-fee schools serving learners from low-income communities [24]. These schools were primarily selected because they were vulnerable, serving children in resource-poor communities, where the majority are recipients of social protection programmes such as the child support grant and beneficiaries of the National School Nutrition Programme (NSNP) [30]. The aim of collecting data in these schools was to inform solution-based interventions to improve child wellbeing and nutritional outcomes among early grade learners [27, 30].
2.2. Data Source
This study used data from the Communities of Practice (CoP) for Child Wellbeing project, collected between 2020 and 2022. The CoP was a collaborative, multidisciplinary intervention research study aimed at improving children’s health, welfare, and educational outcomes in low socio-economic contexts. The goal of the CoP was to integrate education, health, and social development services to improve child well-being outcomes. Guided by the WHO’s Nurturing Care Framework [31], the CoP sought to integrate education, health, and social development services, addressing six key domains of child wellbeing: (1) health; (2) optimal nutrition and food; (3) economic and material wellbeing; (4) education and learning; (5) protection and care; and (6) psychosocial wellbeing [30-33]. The CoP methodology involved a three-year longitudinal approach to track child well-being outcomes while fostering multisectoral collaboration among government departments such as welfare, health, and basic education, which often operate in isolation [27]. Detailed descriptions of the CoP methodology, including variable definitions and measurement within each domain, are available in published reports and supplementary resources at: https://communitiesforchildwellbeing.org/ publications/.
2.3. Target Population and Sample Size
The target population for the baseline in 2020 was Grade R and Grade 1 learners enrolled in the five Johannesburg schools. The aim was to target learners who were in the early years of the foundation phase. The rationale was that learners could be tracked longitudinally for their well-being and nutrition outcomes while still in the foundation phase. The data collection over three years captured data during the COVID-19 economic shock and in post-VID-19 pandemic conditions [32]. Data collection took place between October and November of each study year (2020, 2021, and 2022) among the same cohort of children in participating schools. All anthropometric measurements were conducted on school premises by trained nursing preceptors. This consistent timing within the same months each year helped to minimize the influence of seasonal variation in body weight and growth patterns [33]. Additionally, food availability from the school nutrition programmes was consistent during this period. The distribution of the matched sample for each of the waves is indicated in Table 1.
| Variable | Wave (Year) | ||
|---|---|---|---|
| 2020 | 2021 | 2022 | |
| Sex | - | - | - |
| Female | 58 | 58 | 58 |
| Male | 71 | 71 | 71 |
| Total | 129 | 129 | 129 |
The Sex and Gender Equity in Research (SAGER) Guidelines were followed.
2.4. Sampling Strategy and Data Collection Method
A purposive sampling approach was used to select five low-quintile schools with early grade learners. A list of classes for grades R and 1 per school was provided. Within each grade, a class was randomly selected. Consent forms and study information sheets were given to all children in the selected classrooms. Caregivers of learners who returned the consent forms were contacted, and interviews were scheduled with them. Children had to complete assent forms for their participation. Primary data were collected using the Child Wellbeing Tracking Tool (CWTT). The CWTT tool was co-designed by professionals working with children, including medical health care professionals, social workers, psychologists, teachers, researchers, and practitioners, who each defined what child wellbeing means in their field. The co-design of the CWTT tool was founded on the Nurturing Care Framework (NCF) [31], which assessed child wellbeing from the following six domains: 1) Physical health, 2) Emotional and psychosocial wellbeing, 3) nutrition, 4) educational outcomes, 5) protection and care and 6) household material wellbeing [30, 34]. Regarding the validity and reliability of the tool, because this instrument involved a co-design process, experts reviewed each item and rated how well it reflected the relevant domain.
Additionally, face validity was assessed through pilot testing with teachers, caregivers, and health practitioners to ensure the tool measures what it aims to measure. This process was cross-checked by running the child risk assessment, which flags the child wellbeing domains [30]. To test for reliability, the test-retest method was used. This process allowed the tool to be administered to the same participants each year to assess consistency [31]. These risk assessments were used to deliver tailor-made interventions for children who needed them [34, 35]. From this point, the University of Johannesburg’s (UJ) engineering team developed the digital application of the child wellbeing tool.
This study presents the longitudinal analysis of the 129 children with complete data, matched across all three waves. The other children could not be followed up due to attrition or loss to follow-up [30, 34, 36]. The primary data were collected by five social workers through conducting interviews with the parents, teachers, and children. The same measurement protocols, instruments, and trained field staff were used across all data collection rounds to ensure consistency and minimize measurement bias. The trained nursing preceptors conducted physical health assessments at schools by measuring children’s height, weight, and mid-upper arm circumference, as well as conducting glucose and other chronic tests. The child’s weight was measured to the nearest 0.1 kg using digital floor scales, with the child wearing light clothing and no shoes. The child’s height was measured to the nearest 0.1 cm using a portable stadiometer. All measurements followed the WHO standardized protocols [37].
2.5. Study Variables and Measures
2.5.1. Dependent Variables
The dependent variables for this study were stunting and underweight. Stunting was quantified using standard deviation units (z-scores) relative to the median of the reference population [37]. In this study, children with a height-for-age z-score more than 2 standard deviations below the median of the WHO reference population were considered moderately or severely stunted. For underweight, the WHO child growth standards recommend using the child’s weight-for-age z-score to determine the proportion of underweight children [38]. A child is considered underweight if their weight-for-age z-score is below 2 standard deviations from the median [38]. The implication is that their weight is significantly lower than expected for their age. Therefore, the outcome variables were coded as follows: stunting was coded as 0=not stunted and 1=stunted, while underweight was coded as 0=not underweight and 1=underweight.
2.5.2. Independent Variables
The independent variables used in this study were informed by the existing literature on factors influencing children's nutritional status [39-42]. The following variables were included in the analysis: sex of a child, child support grant, education of the caregiver, employment status of the caregiver, household size, household debt status, depression status of the caregiver, and family support and food security. A detailed description of the variables is presented in Table 2.
| No. | Variable Name | Definition and Measurement |
|---|---|---|
| 1 | Sex of child | The classification of the child under the age of 10 as either male or female. |
| 2 | Child grant support | Indicates whether the child receives government or NGO-provided grant support. Classified as Yes or No. |
| 3 | Education | The highest level of education is attained by the parent or caregiver. Categorized as No education, Primary, Secondary, or Tertiary. |
| 4 | Employment status | Indicates the current employment status of the parent or caregiver. Categorized as Employed, Unemployed, or Informal employment. |
| 5 | Household size | Indicates the size of the household classified as 1-2, 3-4, or 5+ |
| 6 | Debt | Indicates whether the household has any outstanding financial debt. Classified as Yes or No. |
| 7 | Depressive symptoms | Indicates whether the parent/caregiver has a depressive symptom classified as not depressed or depressed. |
2.6. Statistical Analysis
The study utilized Stata 17 for data analysis. A three-level analytical approach was employed: univariate, bivariate, and multivariate analyses. At the univariate level, frequencies and percentages were generated. For instance, baseline data were used to produce the frequencies and percentages of the independent variables. Additionally, trends in stunting and underweight prevalence were examined over the period 2020 to 2022. At the bivariate level, pooled cross-tabulations of data from 2020 to 2022 were conducted to explore the prevalence of stunting and underweight among children with different characteristics. At the multivariate level, with child nutritional status (stunting and underweight) as the dependent variables, seven factors related to children, mothers, and caregivers were included as independent variables. All variables with a significance level of 0.2 were included in the multivariable regression. To account for the correlation of repeated observations from the same children over time, the generalized estimating equations (GEE) model was used at the multivariate stage. Separate multivariate logistic regression models were developed for each nutritional outcome (stunting and underweight) to identify associated factors. The strength of association between the independent variables and child nutritional status was assessed using adjusted odds ratios (aORs) with 95% confidence intervals (CIs). A p-value of less than 0.05 was considered statistically significant in all tests.
2.7. Ethical Approval and Permissions
The CoP study obtained permission from the University of Johannesburg’s Faculty of Humanities (REC-01-050 -2020) and Faculty of Health Sciences Research Ethics Committee (REC241112-035). Additionally, permissions to access schools and conduct research with minors were obtained from the Gauteng Department of Education. This study was a secondary analysis of already collected data; therefore, ethical clearance for this study was granted by the Faculty of Humanities Research Ethics Committee (REC-01-882-2024). We confirm that the Helsinki Declaration has been followed in involving human subjects in the study.
3. RESULTS
Table 3 shows the percentage distribution of pupils' background characteristics at baseline. A total of 129 pupils were captured at baseline, with the highest number of pupils aged 7 to 9 years (69%) and the least aged 9 to 10 years (3%). Regarding the sex of the child, more than half were male (55%), while 45% were female. Regarding the Child Support Grant (CSG), the majority of children (88%) were receiving support, while a minority (12%) were not.
| Background Characteristics | 2020 | |
|---|---|---|
| Frequency | Percent | |
| Age of Child | - | - |
| 5-6 | 36 | 27.91 |
| 7-8 | 89 | 68.99 |
| 9-10 | 4 | 3.1 |
| Sex of Child | - | - |
| Male | 71 | 55.04 |
| Female | 58 | 44.96 |
| Child Support Grant (CSG) | - | - |
| Yes | 114 | 88.37 |
| No | 15 | 11.63 |
Table 4 shows the percent distribution of background characteristics of the pupils' parents/caregivers at baseline. Most parents/caregivers had attained secondary education (85%), while the smallest proportion had attained only primary education (2%). Regarding employment, almost two-thirds of parents/caregivers (65%) were not working, while 36% were employed. The largest proportion of parents/caregivers reported a household size of 1 to 2 members (43%), whereas the smallest proportion reported a household size of 5 or more members (20%). Almost 298% of parents and caregivers reported having debt. Additionally, nearly three-quarters (71%) of parents/ caregivers exhibited depressive symptoms.
| Background Characteristics | 2020 | |
|---|---|---|
| Frequency | Percent | |
| Education of the parent or caregiver | - | - |
| No education | 6 | 4.65 |
| Primary | 3 | 2.33 |
| Secondary | 110 | 85.27 |
| Higher | 10 | 7.75 |
| Employment status | - | - |
| Not working | 83 | 64.34 |
| Working | 46 | 35.66 |
| Household size | - | - |
| 1-2 | 55 | 42.64 |
| 3-4 | 48 | 37.21 |
| 5+ | 26 | 20.16 |
| Debt | - | - |
| Yes | 35 | 28.69 |
| No | 87 | 71.31 |
| Depressive symptoms of the parent or caregiver | - | - |
| Not depressed | 38 | 29.46 |
| Depressed | 91 | 70.54 |
3.1. Prevalence of Child Nutrition Status
Figure 1 presents the trend in the distribution of stunting and underweight among children from 2020 to 2022. The prevalence of stunting decreased by 4%, from 14% in 2020 to 10% in 2022. In contrast, the prevalence of underweight increased by 6%, rising from 6% in 2020 to 12% in 2022.
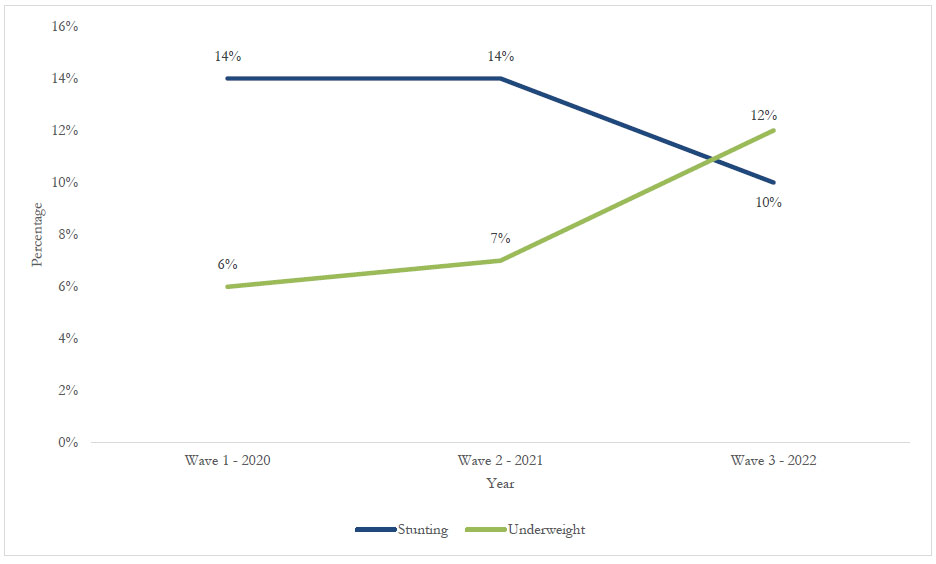
Trend distribution of stunting and underweight among children (2020 to 2022).
Figure 2 shows the trend distribution of stunting by sex. A reduction in stunting was observed in both sexes. For males, stunting decreased from 18% in 2020 to 13% in 2022, representing a 5% reduction. For females, stunting declined from 9% in 2020 to 7% in 2022, representing a 2-percentage-point reduction.
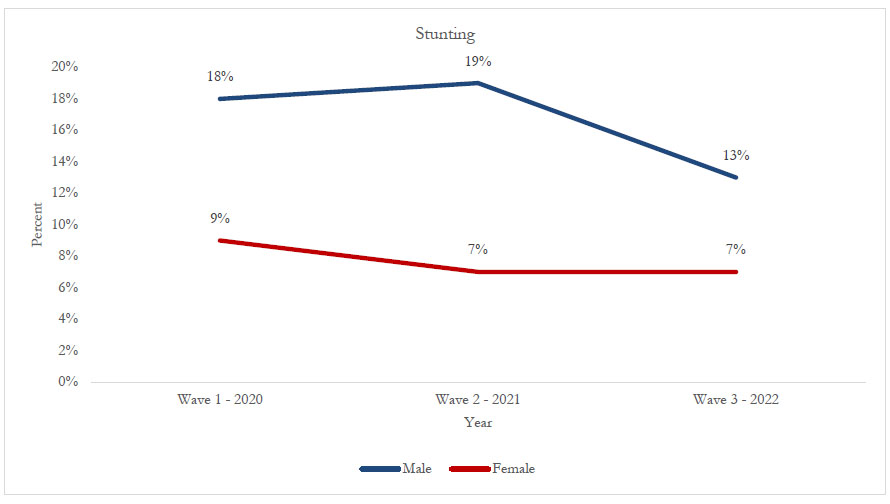
Trend distribution of stunting by sex (2020 to 2022).
Figure 3 shows the trend distribution of underweight by sex. For males, the prevalence of underweight increased from 10% in 2020 to 15% in 2022, reflecting a 5% increase. Similarly, among females, underweight increased from 2% in 2020 to 7% in 2022, a 5% increase.
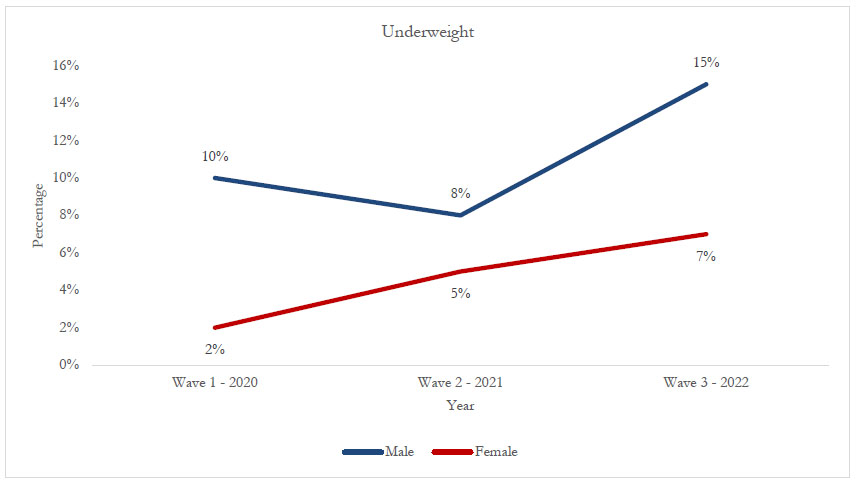
Trend distribution of underweight by sex (2020 to 2022).
The trends in stunting and underweight prevalence from 2020 to 2022, according to the investigated potential covariate factors, are presented in Table 5. The findings show that in 2020, only household size was significantly associated with stunting (p < 0.05). Twenty-seven percent of children from households with five or more members were more likely to be stunted. In 2021, stunting was significantly associated with the child's sex (p < 0.05), with a higher prevalence among males (18%) than among females (9%). In 2022, depressive symptoms of the parent or caregiver were significantly associated with stunting (p < 0.05). Parents or caregivers who reported no depressive symptoms (20%) were more likely to have stunted children compared to those who were depressed. For underweight, no variable was statistically significant across all three years.
| Background Characteristics | Stunting | Underweight | ||||
|---|---|---|---|---|---|---|
| 2020 | 2021 | 2022 | 2020 | 2021 | 2022 | |
| N (%) | N (%) | N (%) | N (%) | N (%) | N (%) | |
| Sex of child | - | * | - | - | - | - |
| Male | 13 (18.57) | 14 (19.72) | 9 (12.68) | 7 (10.14) | 6 (8.45) | 11 (15.49) |
| Female | 5 (8.62) | 4 (6.90) | 4 (7.02) | 1 (1.72) | 3 (5.17) | 4 (7.14) |
| Child Support Grant (CSG) | - | - | - | - | - | - |
| Yes | 18 (15.93) | 16 (15.69) | 12 (11.01) | 8 (7.14) | 7 (6.86) | 13 (12.04) |
| No | 0 | 2 (7.41) | 1 (5.26) | 0 | 2 (7.41) | 2 (10.53) |
| Education of the parent or caregiver | - | - | - | - | - | - |
| No education | 1 (16.67) | 1 (100) | 0 | 1 (16.67) | 0 | 0 |
| Primary | 0 | 1 (10) | 1 (9.09) | 0 | 1 (10.00) | 1 (9.09) |
| Secondary | 17 (15.60) | 13 (12.75) | 11 (11.11) | 7 (6.48) | 7 (6.86) | 11 (11.22) |
| Higher | 0 | 2 (13.33) | 1 (6.25) | 0 | 1 (6.67) | 3 (18.75) |
| Employment status | - | - | - | - | - | - |
| Not working | 12 (14.46) | 13 (16.88) | 6 (7.89) | 5 (6.10) | 5 (6.49) | 10 (13.33) |
| Working | 6 (13.33) | 5 (9.62) | 6 (13.04) | 3 (6.67) | 4 (7.69) | 5 (10.87) |
| Household size | * | - | - | - | - | - |
| 1-2 | 2 (3.70) | 7 (12.07) | 7 (14.00) | 4 (7.27) | 4 (6.90) | 5 (10.00) |
| 3-4 | 9 (18.75) | 6 (12.00) | 3 (5.66) | 4 (8.51) | 3 (6.00) | 7 (13.21) |
| 5+ | 7 (26.92) | 5 (23.81) | 3 (13.04) | 0 | 2 (9.52) | 3 (13.64) |
| Debt | - | - | - | - | - | - |
| Yes | 5 (14.71) | 9 (16.36) | 5 (10.64) | 0 | 4 (7.27) | 7 (15.22) |
| No | 11 (12.64) | 9 (12.16) | 7 (9.72) | 7 (8.14) | 5 (6.76) | 8 (11.11) |
| Depressive symptoms of the parent or caregiver | - | - | * | - | - | - |
| Not depressed | 5 (13.16) | 5 (14.71) | 10 (20.00) | 2 (5.41) | 4 (11.76) | 6 (12.00) |
| Depressed | 13 (14.44) | 13 (13.68) | 3 (3.85) | 6 (6.67) | 5 (5.26) | 9 (11.81) |
| Family support | - | - | - | - | - | - |
| Yes | 8 (18.60) | 16 (15.84) | 9 (10.59) | 4 (9.52) | 6 (5.94) | 12 (14.29) |
| No | 10 (11.76) | 2 (7.14) | 3 (7.89) | 4 (4.71) | 3 (10.71) | 2 (5.26) |
| Food security | - | - | - | - | - | - |
| Yes | 9 (12.50) | 13 (14.13) | 0 | 5 (6.85) | 0 | 12 (13.04) |
| Sometimes | 2 (6.67) | 4 (13.33) | 5 (19.23) | 1 (3.45) | 0 | 2 (8.00) |
| No | 5 (27.78) | 1 (14.29) | 7 (7.61) | 1 (5.88) | 9 (9.78) | 1 (16.67) |
| Total | 18 (14.06) | 18 (13.95) | 13 (10.16) | 8 (6.30) | 9 (6.98) | 15 (11.81) |
Note: Level of significance: * p <0.05.
Table 6 shows the factors associated with stunting during the period 2020 to 2022. For all these years, the sex of a child has been associated with stunting. Male children were more likely to be stunted (aOR=2.25, 95 CI:2.11-8.20) in 2020; (aOR=2.25, 95 CI:2.81-9.30) in 2021, and (aOR=3.04, 95 CI:2.65-14.28) in 2022. As for 2020, only household size was associated with stunting. Showing that households with 3- 4 members were 11 times more likely to have a stunted child (aOR=11.05, 95 CI:1.50-101.95). Those whose household size was 5 or more members were 15 times more likely to have a stunted child (aOR=15.08, 95% CI: 1.54-145.00). As for 2021 and 2022, no variable was associated with stunting.
| Background Characteristics | Stunting | |||||
|---|---|---|---|---|---|---|
| 2020 | 2021 | 2022 | ||||
| aOR | 95% CI | aOR | 96% CI | aOR | 97% CI | |
| Sex of child | - | - | - | - | - | - |
| Male | 2.25* | 2.11-8.20 | 2.81* | 2.80-9.30 | 3.04* | 2.65-14.28 |
| Female | 1 | - | 1 | - | 1 | - |
| Education of the parent or caregiver | - | - | - | - | - | - |
| No education or primary | 1 | - | 1 | - | 1 | - |
| Secondary or tertiary | 1.55 | 0.15-16.28 | 0.75 | 0.13-4.45 | 4.09 | 0.28-60.26 |
| Employment status | - | - | - | - | - | - |
| Not working | 0.75 | 0.21-2.60 | 1.68 | 0.53-5.36 | 0.97 | 0.22-4.36 |
| Working | 1 | - | 1 | - | 1 | - |
| Household size | - | - | - | - | - | - |
| 1-2 | 1 | - | 1 | - | 1 | - |
| 3-4 | 11.95* | 1.40-101.95 | 0.76 | 0.21-2.71 | 0.37 | 0.07-1.98 |
| 5+ | 15.08* | 1.54-145.00 | 1.73 | 0.45-6.70 | 0.79 | 0.13-4.89 |
| Debt | - | - | - | - | - | - |
| Yes | 1.22 | 0.37-5.19 | 1.42 | 0.47-4.34 | 0.83 | 0.19-3.64 |
| No | 1 | - | 1 | - | 1 | - |
|
Depressive symptoms of parent/caregiver |
- | - | - | - | - | - |
| Not depressed | 1 | - | 1 | - | 1 | - |
| Depressed | 1.39 | 0.37-5.19 | 0.85 | 0.25-2.93 | 0.13** | 0.03-0.61 |
| Food security | - | - | - | - | - | - |
| Yes | 0.79 | 0.24-2.62 | 1.09 | 0.33-3.60 | 0.27 | 0.05-1.32 |
| No | 1 | - | 1 | - | 1 | - |
Note: aOR: adjusted odds ratios, * p <0.05; ** p <0.01.
Table 7 shows the factors associated with underweight for the period 2020 to 2022. The results show that no variable was statistically associated with underweight across the three years. However, male children had consistently higher odds of being underweight compared to female children (aOR=5.90, 95 CI:0.66-52.30) in 2020, (aOR=1.69, 95 CI:0.38-7.45) in 2021, and (aOR=2.43, 95 CI:0.69-8.52) in 2022, although the results were not significant.
| Background Characteristics | Underweight | |||||
|---|---|---|---|---|---|---|
| 2020 | 2021 | 2022 | ||||
| aOR | 95% CI | aOR | 96% CI | aOR | 97% CI | |
| Sex of child | - | - | - | - | - | - |
| Male | 5.90 | 0.66-52.30 | 1.69 | 0.38-7.45 | 2.43 | 0.69-8.52 |
| Female | 1 | - | 1 | - | 1 | - |
| Education of the parent or caregiver | - | - | - | - | - | - |
| No education or primary | 1 | - | 1 | - | 1 | - |
| Secondary or tertiary | 0.60 | 0.06-6.25 | 1.02 | 0.10-10.06 | 1.74 | 0.18-17.14 |
| Employment status | - | - | - | - | - | - |
| Not working | 1.05 | 0.21-5.33 | 0.79 | 0.19-3.29 | 1.39 | 0.42-4.61 |
| Working | 1 | - | 1 | - | 1 | - |
| Household size | - | - | - | - | - | - |
| 1-2 | - | - | 1 | - | 1 | - |
| 3-4 | - | - | 0.80 | 0.16-4.07 | 1.2 | 0.33-4.76 |
| 5+ | - | - | 1.14 | 0.17-7.59 | 1.78 | 0.35-8.90 |
| Debt | - | - | - | - | - | - |
| Yes | - | - | - | - | 1.26 | 0.39-4.11 |
| No | - | - | - | - | 1 | - |
| Depressive symptoms of the parent or caregiver | - | - | - | - | - | - |
| Not depressed | 1 | - | 1 | - | 1 | - |
| Depressed | 2.53 | 0.27-23.44 | 0.39 | 0.09-1.70 | 0.85 | 0.25-2.81 |
| Food security | - | - | - | - | - | - |
| Yes | 1.63 | 0.28-9.46 | - | - | 1.66 | 0.40-6.78 |
| No | 1 | - | - | - | 1 | - |
4. DISCUSSION
This study examined the trends and determinants of severe child nutritional status. The study observed changes in stunting and underweight among early-grade learners in low-quintile schools in Johannesburg, South Africa, over the period 2020 to 2022. Although the data were collected during the COVID-19 pandemic, our findings cannot be directly attributed to COVID-19 without further evidence. The analysis acknowledges that external shocks, such as the COVID-19 pandemic, have disrupted school attendance, household income stability, and food supply chains. Caregivers faced severe socio-economic challenges, including high unemployment (64.34%), low higher education attainment (7.75%), heavy reliance on Child Support Grants (88.37%), and elevated depressive symptoms (70.54%). In our study, caregiver depression and food insecurity were measured, but did not show statistically significant associations with nutritional outcomes. Although this study did not find any positive association between caregiver depression and childhood malnutritional outcomes, other findings in a low-income country, such as Ethiopia, found contrasting evidence. For example, these studies found a high distribution of depressive symptoms amongst caregivers of malnourished children, particularly caregivers who were of a poor socioeconomic status, characterized by unemployment, lower levels of education, and poor social support [43, 44]. Additionally, studies have found that macroeconomic factors, such as rising inflation, unemployment, and increases in food prices during 2021 -2022, likely exacerbated household food insecurity [45-47]. While caregiver mental health has been identified in the broader literature as a potential determinant of child nutritional outcomes in South Africa [48], our study did not find a significant association. This may, in part, reflect the small sample size and limited statistical power, highlighting the need for larger-scale studies to further explore this relationship. Additionally, these findings echo findings of a nationally representative study in South Africa, which showed a general increase in depressive symptoms among adults during the COVID-19 pandemic [49].
Looking at the outcome of stunting and underweight, the results show a contrasting trend. Though the prevalence of stunting declined slightly from 14% in 2020 to 10% in 2022, the prevalence of underweight increased significantly, rising from 6% to 12% over the same period. Evidence from other studies suggests that the COVID-19 pandemic has reversed efforts and some gains made on decades of work to reduce children’s poor nutrition outcomes [24, 50-52]. The efforts to reduce chronic malnutrition among early grade learners included school-based feeding programmes, in which, in South Africa, over 9 million children are beneficiaries of the National School Nutrition Programme (NSNP) [53]. However, this service was disrupted during the pandemic because schools implemented a rotation system, where learners did not attend school daily to comply with COVID-19 protocols on social distancing [54]. These set requirements meant that children who would normally benefit from the NSNP could not access the nutritious breakfast or lunch. Previous studies in South Africa found that providing nutritious breakfast and lunch in low-quintile schools helps improve poor nutritional outcomes among children and is a protective factor against food insecurity [17, 18, 55]. Another study in South Africa found a positive association between improved health outcomes and reduced health spending among children who were recipients of the school feeding programme [56].
Similarly, a study that adopted a child-centered approach in South Africa found that children who depend on school nutrition programmes reported that the COVID-19 pandemic had negatively impacted their families. These children reported receiving less varied foods, with limited fruits and proteins at home, and did not have enough food to satisfy their hunger [54]. Our study findings indicate that malnutrition remains an increasing concern. The upward trend in underweight among early grade learners, particularly during the COVID-19 pandemic, points to the impact of household food insecurity, income shocks, and limited access to basic services during and after the pandemic [57]. However, it is noted that stunting reflects chronic undernutrition, particularly during the first 1000 days of a child’s life; therefore, it is highly unlikely to be affected by short-term economic shocks such as the COVID-19 pandemic in older children [58, 59].
Additionally, a study in South Africa found that during the early phases of the COVID-19 pandemic, 15% of households reported child hunger, and 47%id not have enough money to buy food [60]. These findings are echoed in our findings, given the high caregiver unemployment rates. These findings suggest that pandemic-related disruptions, such as household income losses, rising food prices, and reduced dietary quantity and quality, would have immediate effects on weight. While the longitudinal data followed the same group of children across the three rounds, variations in the relationship between stunting and household size across years may reflect the dynamic social and economic context within which households operated. In 2020, the association between larger household size and higher stunting prevalence likely reflects the compounded resource constraints faced by bigger families during the onset of the COVID-19 pandemic, when school closures and income disruptions were most severe. By 2021 and 2022, during the Covid-19 pandemic, South Africa saw an expansion of the social protection programmes such as the child support grant in a form of a top-up, an introduction of the temporary COVID-19 Social Relief of Distress Grant (SRD), which buffered food insecurity in some households, thus benefiting children who were currently stunted by stabilizing their diet quality and diversity [61]. These year-specific fluctuations suggest that the determinants of child nutrition are not static but interact with broader shocks and recovery processes.
A consistent and significant finding across both bivariate and multivariate analyses was the association between the child's sex and nutritional outcomes. Male learners were significantly more likely to be stunted and underweight compared to female learners. This gender disparity aligns with findings from previous studies in other low- and middle-income countries [62-64]. This finding holds for children even younger than those in the early grades (5–9 years). For example, a recent systematic review on sex differences in undernutrition among children under 5 years found that boys, when compared to girls, had a higher likelihood of being stunted (OR 1.29) and underweight (OR 1.14) [65]. Similarly, in South Africa, a study found a higher prevalence of underweight among boys (5.97%) compared to girls (2.52%), with a statistically significant relationship [64]. Further evidence shows that boys are more biologically vulnerable to environmental and nutritional stressors or may receive differential treatment compared to girls in how they are cared for in resource-constrained households [65-67]. Given that these findings are based on low-quintile schools representing low socioeconomic status, some studies attribute sex differences in nutritional outcomes to lower socioeconomic status [68]. Evidence shows that childcare practices such as poor nutrition, poor hygiene and sanitation, and a lack of access to health care services can influence children’s nutritional outcomes [21, 29]. The consistently higher prevalence of both stunting and underweight among boys in this study highlights the need for gender-sensitive interventions in school health and nutrition programmes.
Despite the high levels of poverty among the sample, with 88.37% of children receiving the CSG and 64.34% of caregivers being unemployed, socioeconomic variables such as caregiver education, employment status, household size, and debt status did not show strong associations with child nutritional status in adjusted models. These findings contrast with the available evidence in low- and middle-income countries, given that when caregivers are unemployed or have low educational attainment, they are likely to have reduced employment opportunities and reduced household income, which can negatively impact the children’s access to adequate food and nutrition [69-72]. Our findings on socio-economic variables suggest that there is a need to probe further into the social contextual determinants driving children’s nutritional outcomes, including cultural factors, childcare practices, dietary practices, and the types of childcare children receive [6, 73, 74]. In addition to the CSG being protective against malnutrition, other evidence shows its contribution to improving school enrolment rates in South Africa. However, concerns have been raised about its adequacy in meeting children’s nutritional needs in economically vulnerable communities, particularly after the economic shock of the COVID-19 pandemic [75-77]. Despite this positive relationship, there have been calls to increase the CSG grant amount, currently R560 ($31), to meet the poverty line of R796 ($44) [78, 79].
The urban, resource-poor communities and low-quintile school settings in this study fill an important research gap. Although there are investments in national and provincial-level data collection on nutrition, including the South African Health and Demographic Survey, the South African Nutrition Survey, nd the National Income Dynamics Study (NIDS), these surveys often fail to capture the lived realities of children in low-income communities [80, 81]. To capture the lived realities of children in specific vulnerable communities, such as urban townships and no-fee schools, the study's strength lies in its community-based focus on early grade learners (ages 5–9). Moreover, this study highlighted an age group often overlooked in national nutrition surveillance, as many studies focus on children under five. Often, large-scale surveys use sampling methods that promote national representativeness, thereby obscuring localized variations in child nutritional outcomes. Although there have been interventions such as the introduction of health and demographic surveillance systems, which provide longitudinal data, these surveillance systems are also limited in the sense that they are geographically limited to specific communities and do not necessarily reflect conditions across other poor communities in the country [82-85].
5. STUDY LIMITATIONS
The major limitation of this study is the small sample size and localized setting, which may have limited the statistical power to detect more nuanced associations. Therefore, our findings cannot be overgeneralized to national or broader urban contexts in South Africa. Additionally, the lack of statistical significance may reflect limited power and possible measurement error; thus, future studies should examine this researcher in larger samples to improve the measurement of confounders. Additionally, the use of self-reported measures for variables such as food security and caregiver mental health may be subject to reporting biases. Nevertheless, the study’s longitudinal design and its focus on an under-researched population in low-resourced urban communities represent important strengths.
CONCLUSION AND RECOMMENDATIONS
In conclusion, although there has been some progress in reducing stunting in South Africa, the apparent rise in underweight among boys may partly reflect sample size limitations (n=79 boys) and natural variation in growth trajectories. Therefore, we interpret this finding not as a confirmed trend but as an emerging signal warranting closer surveillance in similar school populations. The changing age composition of the cohort over time (from 5–9 years in 2020 to 7–13 years in 2022) may reflect differences in growth patterns relative to the WHO reference population, rather than clear improvements in nutritional status. While consistent with broader national patterns of stunting decline, our findings highlight the importance of larger longitudinal studies with repeated measures analyses to disentangle true nutritional improvements from age-related growth dynamics. While stunting is largely determined in the first years of life and may have stabilized due to the buffering effects of the National School Nutrition Programme (NSNP), the Child Support Grant, and the temporary COVID-19 Social Relief of Distress (SRD) grant, underweight children proved more sensitive to short-term shocks. The findings emphasize the need for context-specific, gender-sensitive, and child-centred nutrition policies and programmes. As South Africa continues to navigate the consequences of the COVID-19 pandemic, efforts should be made to promote child nutrition in low-quintile schools to safeguard the development of the country’s potential leaders.
Additionally, future studies should assess pandemic-related effects on stunting through follow-up of younger cohorts (under 3 years during the pandemic). Furthermore, these studies should expand the sample size and undertake an in-depth exploration of intra-household food allocation, variations in school feeding, longitudinal dietary intake, as well as household and cultural factors that influence child malnutrition. Given that the caregiver's depressive symptoms were high, interventions should focus on providing support programmes for caregivers, such as supporting and empowering caregivers with skills to start their own businesses or linking them to employment opportunities [86]. Further research is needed to explore the psychosocial dimensions of child nutrition, particularly in post-pandemic settings. Given the increased risk of child malnutrition among boys and the limited cushioning effect of current social protection programmes such as the CSG grants, interventions must be holistic, targeting family well-being to improve children’s nutritional and overall well-being [87, 88]. Although there are family support programmes like Sihleng’imizi in South Africa, the high levels of caregiver depression specifically call for more integrated support systems that go beyond nutritional supplementation to include mental health and family support. Challenges with programmes such as Sihleng’imizi include their lack of scale-up, leaving gaps in child nutrition and family support within the nutrition and education policy frameworks [88-90]. From a policy perspective, the findings call for a strengthened focus on school-based nutrition interventions that begin in the early grades. This focus is particularly important if we are to reach the Sustainable Development Goals (SDGs) 2 (zero hunger), 3 (good health and well-being), and 4 (quality education) by 2030 [91, 92]. This goal recognizes that child nutrition, health, and learning outcomes are intimately linked. There is also an urgent need for intersectoral collaboration across education, health, and social development departments to ensure that nutritional support for children in schools is consistent and that children have responsive caregiving [21, 27, 34, 93, 94]. In the South African context, these findings also align with the priorities of the National Development Plan (NDP). The NDP seeks to reduce child stunting by 10% by 2030 by ensuring that all children have access to adequate and nutritious food, early learning and education, and responsive caregiving [95].
AUTHORS’ CONTRIBUTIONS
The authors confirm contribution to the paper as follows: M.S.: Study conception, manuscript writing, and data collection were performed; M.P.: Methodology, data analysis, and interpretation were conducted; N.F.: Contributed to manuscript writing and the literature search; E.M.: was responsible for data cleaning and analysis; L.P.: Contributed to study conception, design, review, and final edits. All authors reviewed the results and approved the final version of the manuscript.
LIST OF ABBREVIATIONS
| CoP | = Community of Practice |
| ISNP | = Integrated School Nutrition Programme |
| NSNP | = National School Nutrition Programme |
| NFNSS | = National Food and Nutrition Security Survey |
| SAGER | = Sex and Gender Equity in Research |
| CWTT | = Child Wellbeing Tracking Tool |
| NCF | = Nurturing Care Framework |
| GEE | = Generalized Estimating Equations |
| CIs | = Confidence Intervals |
| SRD | = Social Relief of Distress |
| SDGs | = Sustainable Development Goals |
| NDP | = National Development Plan |
ETHICS APPROVAL AND CONSENT TO PARTICIPATE
Ethical clearance for this study was granted by the Faculty of Humanities Research Ethics Committee, Zambia (REC-01-882-2024).
HUMAN AND ANIMAL RIGHTS
All human research procedures followed were in accordance with the ethical standards of the committee responsible for human experimentation (institutional and national), and with the Helsinki Declaration of 1975, as revised in 2013.
CONSENT FOR PUBLICATION
Consent forms and study information sheets were given to all children in the selected classrooms. Caregivers of learners who returned the consent forms were contacted, and interviews were scheduled with them.
AVAILABILITY OF DATA AND MATERIALS
The data supporting the findings of this study are available from the corresponding author [S.M] upon reasonable request. Due to ethical considerations and the inclusion of sensitive information about children and their households, data access is restricted to protect participant confidentiality. Any data sharing will be subject to approval by the University of Johannesburg ethics committee and in accordance with data protection regulations.
FUNDING
The support of the DSI-NRF Centre of Excellence in Human Development towards this research/activity is hereby acknowledged. Opinions expressed and conclusions reached are those of the authors and are not necessarily attributable to the CoE in Human Development.
ACKNOWLEDGEMENTS
Declared none.

