All published articles of this journal are available on ScienceDirect.

Associations between Anthropometric Indicators, Demographic Characteristics, and Nutritional Status in Pediatric Congenital Heart Disease
Authors Info & Affiliations
Abstract
Introduction
The nutritional status of children is one of the major issues in CHD, which is considered an important factor in mortality and morbidity. This study aimed to determine the relationships among anthropometric indicators, demographic information, and the severity of heart disease with nutritional status in CHD.
Methods
This cross-sectional analytical study was conducted using a convenience sampling method on 127 children aged 1 to 17 years who were diagnosed with CHD in northeastern Iran. Data were collected using a demographic information questionnaire, a researcher-made checklist of anthropometric indices, a nutritional status assessment checklist with Z-score index, a checklist of examinations and clinical assessments performed by pediatric cardiologists, and data obtained from the Quantum Magnetic Resonance Analyzer. Data were analyzed using descriptive and inferential statistics in SPSS-20 software at a significance level of P<0.05.
Results
Results found that cyanotic CHD was the most prevalent anomaly (60.6%), and most children (76.4%) had appropriate birth weights for gestational age. Greater severity of heart failure was associated with lower weight-for-age and height-for-age Z-scores (P=0.003 and P=0.031, respectively). Higher parental educational attainment was positively associated with height and mid-upper arm circumference (P=0.008 and P=0.022).
Discussion
Malnutrition is frequently observed among children with CHD. Malnutrition significantly impacts the anthropometric parameters, specifically the weight and height, of children with CHD.
Conclusion
Targeted nutritional interventions are recommended to mitigate the risk of malnutrition and facilitate the attainment of optimal weight and height.
1. INTRODUCTION
Congenital heart diseases (CHD) are structural cardiovascular disorders [1, 2] and are among the most common cardiac conditions in children, affecting between 3.7 and 17.5 per 1,000 live births [3, 4]. The prevalence of CHD in Iran is 8.6 per 1,000 live births. This rate is 9.96 per 1,000 live births in boys and 7.34 per 1,000 live births in girls [5]. CHD is also recognized as the most common hereditary disorder, accounting for one-third of all congenital anomalies [1, 6]. This condition creates significant challenges, with profound effects on morbidity, mortality, and healthcare costs [7, 8]. Children with CHD typically show symptoms soon after birth; however, a portion of them are diagnosed during childhood. Children with CHD are prone to poor nutritional status and often experience growth failure [9-12]. Other factors that influence children's nutritional status alongside CHD include age, gender, obstetrical history, and medical history [13-15]. CHD is often associated with malnutrition and failure to thrive [16, 17]. The prevalence of failure to thrive in patients with CHD in developing countries has been estimated at 64% [18]. Although this condition is particularly severe in developing regions, malnutrition is also common even among healthy children [11, 15]. In Iran, the most recent study conducted by Noori et al. revealed that 47.25% of children with CHD suffer from FTT (weight and height below the 5th percentile) [19]. The mechanisms of growth failure are multifactorial and include associated chromosomal abnormalities, genetic syndromes, inadequate nutrition due to feeding difficulties, and poor nutrient absorption from the gastrointestinal tract in patients with congenital heart failure (CHF) [20, 21].
Additionally, increased caloric expenditure is necessary to maintain myocardial function, respiration, and neurohumoral function in patients with CHD and heart failure. Chronic heart disease and chronic hypoxia in CHD lead to reduced cellular metabolism and growth, while recurrent chest infections further increase metabolic demands [22-24]. Malnutrition in children with CHD is associated with increased mortality and morbidity, linked to frequent hospitalizations, poor surgical outcomes, and persistent somatic growth impairment [11, 25, 26]. Approximately 6% of infants with CHD experience intrauterine growth restriction (IUGR). Furthermore, extracardiac malformations or known syndromes (including trisomy 21 and 18, Turner syndrome, and some other syndromes) contribute to growth impairment in these children for non-cardiac reasons [27]. Patients with increased pulmonary blood flow and pulmonary hypertension are prone to malnutrition and growth failure. Hypoxia in patients with cyanosis and pulmonary hypertension exacerbates feeding difficulties. Other issues in these patients include inadequate nutrition, recurrent infections, and intestinal parasitic infestations [28, 29]. Acute malnutrition (low weight-for-age) is observed in 1/3 of patients, while chronic malnutrition (low height-for-age) is observed in 2/3 of patients. About 60% of children with left-to-right shunts and up to 70% of cyanotic or heart disease patients meet the criteria for malnutrition. Early diagnosis of malnutrition in children with CHD is crucial for appropriate nutritional interventions and to prevent the short- and long-term complications of malnutrition, which have irreversible effects on growth and development [30].
Studies in developed countries have shown that early surgical correction of cardiac problems improves somatic growth and normalizes growth parameters. In developing countries, due to limited resources, corrective surgical interventions for CHD are often delayed, creating a vicious cycle where patients develop congestive heart disease and recurrent lung infections [31, 32]. As a result, a high prevalence of malnutrition is observed in children with CHD before surgery. In a study by Marino BL et al., malnutrition and preoperative respiratory infections did not significantly affect short-term outcomes after surgical repair of large VSDs. However, a relative improvement in somatic growth was reported during a 5-year follow-up. This study examined the prevalence of malnutrition, its contributing factors, and the impact of surgical correction on nutritional status in the short term [33]. This growth and developmental impairment can lead to major problems; if left untreated, it can result in permanent disability, whereas nutritional interventions can improve post-surgical outcomes. In some cases, growth impairment is relatively mild, while in others, it can lead to permanent physical disability or developmental delays [10, 34]. To address these issues, a systematic approach should be used to identify the specific causes of growth impairment. Parental education is considered the best strategy for treating malnutrition in these children [20]. Although the causes of abnormal growth and development are multifactorial, reduced energy intake, increased energy requirements, or both may play the most significant roles [35]. Aggressive nutritional strategies should be implemented early in childhood to prevent permanent growth impairment [36]. Most children with CHD eventually require corrective surgery. In many cases, surgery is performed as soon as the child reaches an ideal weight [37, 38]. When infants fail to achieve adequate growth despite aggressive feeding programs, surgery may be recommended despite the increased mortality and complications associated with cardiac surgery in underweight infants [39, 40]. Surgical correction of congenital heart defects reduces energy expenditure, which is a major cause of growth impairment in these children [25, 36]. Early diagnosis of malnutrition in children with CHD is crucial for appropriate nutritional interventions and to prevent the short- and long-term complications of malnutrition, which have irreversible effects on growth and development. In this study, it was postulated that higher disease severity, along with lower parental educational attainment and socioeconomic status, would be associated with less favorable anthropometric profiles and indicators of nutritional status. Accordingly, this study was undertaken to comprehensively examine the associations between key anthropometric parameters (including weight, height, head circumference, and mid-upper arm circumference), selected demographic and socioeconomic characteristics (such as parental education and occupational status), and the clinical severity of CHD, in relation to the nutritional status of pediatric patients with CHD. We postulated that higher disease severity, together with lower parental educational attainment and socioeconomic status, would be associated with less favorable anthropometric profiles and indicators of nutritional status.
2. METHODS
2.1. Study Design and Setting
This study employed a cross-sectional analytical design to examine associations between anthropometric indicators, demographic characteristics, and clinical severity of congenital heart disease in pediatric patients. It was conducted using convenience sampling with 127 children aged 1 to 17 years diagnosed with CHD who visited the pediatric cardiology clinic at Imam Reza Hospital and specialized pediatric cardiology clinics in Mashhad, located in northeastern Iran.
2.2. Study Population and Sample Size Determination
Based on a previous study by Vaidyanathan et al. [41], with α=0.05 and β=0.2, the sample size was calculated to be 127 patients. First, the researcher explained the study objectives to the parents, and after obtaining informed consent, data collection was carried out. Inclusion Criteria: Children aged 1 to 17 years with a confirmed diagnosis of CHD, as determined by a pediatric cardiologist and confirmed echocardiographic evaluation, were eligible to participate. Participants were required to be clinically stable and attending outpatient pediatric cardiology clinics for follow-up or evaluation. Only patients whose parents or legal guardians provided written informed consent were included. Children were excluded if they met any of the following conditions: Critical illness requiring hospitalization at the time of enrollment. Presence of other significant congenital malformations or chromosomal abnormalities (e.g., Down syndrome, Turner syndrome, or other syndromic conditions) that could independently affect growth. History of prematurity (<37 weeks of gestation) or low birth weight unrelated to CHD. Gastrointestinal or neurological disorders (such as cerebral palsy or structural GI anomalies) are known to influence feeding or growth. Previous cardiac surgery or palliative procedures before the study were exclusion criteria. A lack of definitive echocardiographic confirmation of CHD diagnosis was also an exclusion criterion.
2.3. Study Tools
Data collection was conducted during routine outpatient clinic visits. After obtaining informed consent, demographic and clinical data were collected through structured parental interviews and medical record reviews. Anthropometric measurements were obtained in a standardized sequence prior to clinical examination. Clinical severity of heart disease was assessed independently by a pediatric cardiologist using standardized clinical criteria. The data collection tools included a demographic information questionnaire, a researcher-made checklist for anthropometric indices, a checklist for nutritional status assessment using the Z-score index, a checklist for clinical examinations and evaluations conducted by pediatric cardiology specialists, and data obtained from the Quantum Magnetic Resonance Analyzer. The researcher-made checklists were developed based on an extensive review of relevant literature and existing standardized assessment tools. Content validity was evaluated by a panel of pediatric cardiologists and pediatric nutrition specialists, who reviewed the instruments for clarity, relevance, and completeness. Minor revisions were made based on expert feedback prior to data collection. Given the observational nature of the study and the use of objective anthropometric measurements, formal reliability testing was not deemed necessary.
Demographic information of the children was collected through interviews with their parents. A 703 seca scale with its specific measuring tape was used to measure the weight and height of children older than two years, while a 374 seca scale and a 233 seca height meter were used for children younger than two years. Additionally, a WHO-specific tape was used to measure mid-upper arm circumference, and a specialized tape was used to measure head circumference. Anthropometric measurements, including weight, height, head circumference, and mid-upper arm circumference, were recorded by the researcher in the researcher-made checklist. The Z-score was calculated based on age and gender using the WHO growth charts. Specifically, a Z-score of less than -3 was classified as severe malnutrition, between -3 and -2 as moderate malnutrition, and between -2 and -1 as mild malnutrition. After taking relevant history, the patients had a detailed general examination, including clinical pallor, cyanosis, axillary temperature, pulse, and respiratory rate. Pulse oximetry (SpO2) was measured with a Beurer GmbH pulse oximeter (Z24/002436). A detailed precordial examination was done, including auscultation with a Littmann® Classic IIITM Stethoscope.
Additionally, the following information was recorded in the checklists: age, gender, underlying cardiac disease type (cyanotic or non-cyanotic, high flow or low flow), type of nutrition (breast milk, formula, or complementary feeding), time of weaning from breast milk, appetite status, symptoms of malnutrition (FTT), and the severity grading of heart disease as follows: no limitation or symptoms, mild tachypnea or diaphoresis during feeding in infants, dyspnea during exercise in children, with no growth impairment, marked tachypnea or diaphoresis during feeding or exercise, prolonged feeding time, with growth impairment and symptoms at rest (tachypnea, retractions, grunting, or diaphoresis) [42].
The findings recorded in the checklists based on the Quantum Magnetic Resonance Analyzer for assessing malnutrition included the following: Vitamin A, Vitamin B1, Vitamin B2, Vitamin B3, Vitamin B6, Vitamin B12, Vitamin C, Vitamin D, Vitamin E, Vitamin K, Ca, P, K, Fe, Mg, Zn, Folic Acid, Coenzyme Q10.
The anthropometric measurements, including weight and height, were performed according to World Health Organization (WHO) standards and procedures. The Z-score for weight for age (WAZ), weight for height (WHZ), and height for age (HAZ) were calculated using the anthropometric calculator module of WHO Anthro software (version 3.2.2, January 2011) based on the 2006 WHO child growth standards. Height was measured in a standing position (using a Seca 703 scale) for children over 2 years of age, and by backrest for children under 2 years of age (using a Seca 374 weight-height meter with a Seca 233). Heavy clothing and shoes were removed, and the patient's weight was measured on a daily-calibrated scale according to the manufacturer's instructions. The patient’s height was also measured, and BMI was calculated. A Seca scale also measured and recorded the patient's head circumference. The same trained researcher performed all anthropometric measurements to minimize inter-observer variability. Measurement instruments were calibrated daily according to manufacturer guidelines. Each measurement was obtained twice, and the mean value was recorded to enhance accuracy and reproducibility.
2.4. Statistical Analysis
Data analysis was performed using SPSS version 20.0. The Kolmogorov-Smirnov test was used to evaluate the distribution of data. Data with a normal distribution were presented as means ± standard deviations (SD), and comparisons between the two groups were performed using a t-test. Non-normally distributed data were presented as medians and interquartile ranges, and the medians of the two groups were compared using the Mann-Whitney U test. Categorical data were presented as frequencies and percentages, and the Chi-square test was used. Multivariate logistic regression analysis computed odds ratios (ORs), 95% confidence intervals (CIs), and P-values. A P<0.05 was considered statistically significant.
3. RESULTS
A total of 127 children with CHD were evaluated. The most frequent gender was female (65 individuals, 51.2%). Children under 5 years of age had the highest frequency (57 individuals, 44.9%) in the age variable. Approximately 91.3% of the individuals had no associated syndromes, accounting for 116 of the studied children. The highest frequency and percentage of anomalies were in the non-cyanotic group (77 individuals, 60.6%). Birth weight based on gestational age was most frequently in the AGA group (97 individuals, 76.4%). (Table 1)
According to Fig. (1), the highest percentage in the non-cyanotic group is for the VSD category (36.2%), and the lowest is for the MS category (0%). In the cyanotic group, the highest frequency is in the TOF category (16.5%), and the lowest is in the TAPVC category (0.8%).
| Variable | Frequency | Percentage (%) |
|---|---|---|
| Gender | - | - |
| Female | 65 | 51.2 |
| Male | 62 | 48.8 |
| Age of Patients | - | - |
| 0-5 years | 57 | 44.9 |
| 5-11 years | 49 | 38.6 |
| 11 years and above | 21 | 16.5 |
| Syndrome | - | - |
| Negative | 116 | 91.3 |
| Down | 8 | 6.3 |
| Noonan | 3 | 2.4 |
| Associated Anomaly | - | - |
| Cyanotic | 17 | 13.4 |
| Non-Cyanotic | 77 | 60.6 |
| Complex (Cyanotic + Non-Cyanotic) | 13 | 10.2 |
| Cardiomyopathy | 16 | 12.6 |
| Ebstein | 4 | 3.1 |
| Weight Based on Gestational Age | - | - |
| AGA (Appropriate for Gestational Age) | 97 | 76.4 |
| SGA (Small for Gestational Age) | 13 | 10.2 |
| LGA (Large for Gestational Age) | 17 | 13.4 |
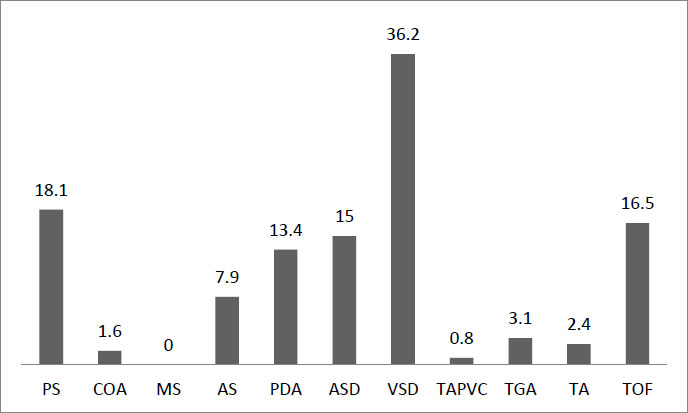
Subcategories of cyanotic and non-cyanotic anomalies in children with CHD.
| BMI Z-score Up to 60 Months, by Gender | |||||||||
|---|---|---|---|---|---|---|---|---|---|
| Less than -3 | -3 to -2 | -2 to -1 | -1 to 0 | 0 to 1 | 1 to 2 | 2 to 3 | Greater than 3 | Total | |
| Girls | 4(12.12%) | 5(15.15%) | 10(30.30%) | 9(27.27%) | 3(9.09%) | 1(3.03%) | 0 | 1(3.03%) | 33(100%) |
| Boys | 3(12.50%) | 4(16.66%) | 5(20.83%) | 7(29.16%) | 3(12.50%) | 2(8.33%) | 0 | 0 | 24(100%) |
| Total | 7(12.28%) | 9(15.79%) | 15(26.32%) | 16(28.07%) | 6(10.53%) | 3(5.26%) | 0 | 1(1.75%) | 57(100%) |
| BMI Z-score Over 60 Months, by Gender | |||||||||
| Less than -3 | -3 to -2 | -2 to -1 | -1 to 0 | 0 to 1 | 1 to 2 | 2 to 3 | Greater than 3 | Total | |
| Girls | 4(12.50%) | 5 (15.62%) | 9 (28.12%) | 3 (9.37%) | 7 (21.87%) | 3(9.37%) | 1(3.12%) | 0 | 32(100%) |
| Boys | 3 (7.89%) | 6 (15.78%) | 5(13.15%) | 14(36.84%) | 4 (10.52%) | 3(7.89%) | 3(7.89%) | 0 | 38(100%) |
| Total | 7(10.00%) | 11(15.71%) | 14(20.00%) | 17(24.29%) | 11(15.71%) | 6(8.57%) | 4(5.71%) | 0 | 70(100%) |
The average BMI Z-score for girls and boys up to 60 months is 13.70 and 14.28, respectively, and for ages over 60 months, it is 15.60 and 16.14, respectively. The frequency of this variable by age and gender is shown in Table 2. The highest frequency in girls up to 60 months is in the range of -2 to -1 (10 people, 30.30%), and in boys in this age group, it is in the range of -1 to 0 (7 people, 29.16%). In the age group over 60 months, the highest frequency for girls is in the range of -2 to -1 (9 people, 28.12%) and for boys in the range of -1 to 0 (14 people, 36.84%).
Determination of the Mean and Frequency of Z-scores for Weight, Height, Head Circumference, and Arm Circumference in Children with CHD. The results of the height Z-score frequency analysis were as follows: 3 patients had severe stunting, 11 were short, 109 were normal, 2 were tall, and 2 had severe tallness. Overall, the mean height Z-score was -0.352, which falls within the normal range.
The frequency of weight Z-scores was as follows: 12 had severe wasting, 19 were wasted, 34 were at risk for wasting, 54 were in the normal range, 6 were at risk for obesity, and 2 were overweight. Overall, the mean weight Z-score was -1.15, which falls within the at-risk-for-wasting range.
In this study, patients' head circumference Z-scores were examined for children up to 36 months; 17 were in the normal range and 3 in the microcephaly range. Overall, the mean head circumference Z-score was -0.92, which falls within the normal range.
In this study, patients' arm circumference was examined in children up to 60 months, with 56 in the normal category and 1 in the severe malnutrition category. Overall, the mean arm circumference Z-score was 15.73, which falls within the normal range.
Table 3 shows the frequency distribution of vitamins and minerals in children with CHD. This table reports the frequency (number) and percentage of each vitamin and mineral in four categories.
One-way ANOVA revealed a significant difference in birth and gestational weight (P=0.002). A significant association were observed in weight and cardiac disease severity (P=0.003), maternal weight and occupation (P<0.001), height and weight based on gestational age (P< 0.048), height and syndrome (P<0.006), height and mother's education (P<0.008), mother's height and occupation (P< 0.018), height and cardiac failure severity (P<0.031), head circumference and syndrome (P<0.003), head circumference and maternal education (P<0.001), and arm circumference and father's education (P<0.022) (Table 4).
| Vitamins and Elements | Severely Abnormal | Moderately Abnormal | Mildly Abnormal | Normal | |
|---|---|---|---|---|---|
| Vit. A | Frequency | 1 | 24 | 54 | 48 |
| Percentage | 0.8% | 18.9% | 42.5% | 37.8% | |
| Vit. B1 | Frequency | 1 | 31 | 32 | 63 |
| Percentage | 0.8% | 24.4% | 25.2% | 49.6% | |
| Vit. B2 | Frequency | 0 | 9 | 48 | 70 |
| Percentage | 0% | 7.1% | 37.8% | 55.1% | |
| Vit. B3 | Frequency | 0 | 30 | 21 | 76 |
| Percentage | 0% | 23.6% | 16.5% | 59.8% | |
| Vit. B6 | Frequency | 9 | 12 | 20 | 86 |
| Percentage | 7.1% | 9.4% | 15.7% | 67.7% | |
| Vit. B12 | Frequency | 0 | 11 | 23 | 93 |
| Percentage | 0% | 8.7% | 18.1% | 73.2% | |
| Vit. C | Frequency | 0 | 108 | 18 | 1 |
| Percentage | 0% | 85% | 14.2% | 0.8% | |
| Vit. D | Frequency | 1 | 3 | 50 | 73 |
| Percentage | 0.8% | 2.4% | 39.4% | 57.5% | |
| Vit. E | Frequency | 0 | 50 | 17 | 60 |
| Percentage | 0% | 39.4% | 13.4% | 47.2% | |
| Vit. K | Frequency | 0 | 29 | 25 | 73 |
| Percentage | 0% | 22.8% | 19.7% | 57.5% | |
| Ca | Frequency | 0 | 0 | 14 | 113 |
| Percentage | 0% | 0% | 11% | 89% | |
| P | Frequency | 0 | 0 | 35 | 92 |
| Percentage | 0% | 0% | 27.6% | 72.4% | |
| K | Frequency | 28 | 25 | 36 | 38 |
| Percentage | 22% | 19.7% | 28.3% | 29.9% | |
| Fe | Frequency | 0 | 21 | 74 | 32 |
| Percentage | 0% | 16.5% | 58.3% | 25.2% | |
| Folic Acid | Frequency | 1 | 8 | 31 | 87 |
| Percentage | 0.8% | 6.3% | 24.4% | 68.5% | |
| Mg | Frequency | 0 | 0 | 54 | 73 |
| Percentage | 0% | 0% | 42.5% | 57.5% | |
| Zn | Frequency | 0 | 58 | 29 | 40 |
| Percentage | 0% | 45.7% | 22.8% | 31.5% | |
| Q10 | Frequency | 0 | 1 | 117 | 9 |
| Percentage | 0% | 0.8% | 92.1% | 7.1% |
| Z-score | Variable | Category | Mean | Standard Deviation | p-value |
|---|---|---|---|---|---|
| Weight | Birth weight by week | AGA | -1.02 | 1.39 | 0.002 |
| SGA | -2.80 | 3.5 | |||
| LGA | -0.62 | 1.55 | |||
| Severity of heart disease | 1 | -1.14 | 1.90 | 0.003 | |
| 2 | -0.91 | 1.58 | |||
| 3 | -3.75 | 1.31 | |||
| 4 | 0 | 0 | |||
| Mother's occupation | Housewife | -1.12 | 1.43 | 0.000 | |
| Laborer | -13.57 | - | |||
| Employee | -0.419 | 1.69 | |||
| Self-employed | -0.540 | 0.820 | |||
| Height | Birth weight by week | AGA | -0.255 | 1.32 | 0.048 |
| SGA | -1.22 | 1.23 | |||
| LGA | -0.241 | 1.40 | |||
| Syndrome | Negative | -0.247 | 1.27 | 0.006 | |
| Down | -1.10 | 1.64 | |||
| Noonan | -2.40 | 1.40 | |||
| Mother's education | Below diploma | -0.756 | 1.29 | 0.008 | |
| Diploma and an associate degree | 0.032 | 1.22 | |||
| Bachelor's and master's degrees | -0.190 | 1.50 | |||
| Mother's occupation | Housewife | -0.380 | 1.28 | 0.018 | |
| Laborer | -4.10 | - | |||
| Employee | 0.066 | 1.47 | |||
| Self-employed | 0.550 | 1.90 | |||
| Severity of heart disease | 1 | -0.411 | 1.31 | 0.031 | |
| 2 | -0.143 | 1.32 | |||
| 3 | -1.76 | 1.44 | |||
| 4 | 0 | 0 | |||
| Head Circumference | Syndrome | Negative | -0.40 | 0.96 | 0.003 |
| Down | -3.00 | 2.48 | |||
| Noonan | 0 | 0 | |||
| Mother's education | Below diploma | -1.15 | 0.827 | 0.000 | |
| A diploma and an associate degree | 0.125 | 0.804 | |||
| Bachelor's and master's degrees | -6.70 | - | |||
| Arm Circumference | Father's education | Below diploma | 14.92 | 1.62 | 0.022 |
| A diploma and an associate degree | 15.30 | 1.54 | |||
| Bachelor's and master's degrees | 21.08 | 15.16 | |||
| Vitamin A | Income | No income | 0.313 | 0.04 | 0.021 |
| Below 1 million | 0.343 | 0.022 | |||
| 1-2 million | 0.336 | 0.026 | |||
| 2-4 million | 0.346 | 0.024 | |||
| Above 4 million | 0.331 | 0.036 | |||
| Q10 | Income | No income | 0.77 | 0.095 | 0.024 |
| Below 1 million | 0.75 | 0.066 | |||
| 1-2 million | 0.74 | 0.092 | |||
| 2-4 million | 0.759 | 0.147 | |||
| Above 4 million | 0.930 | 0.361 |
| Variable | Group 2 | Group 1 | Mean Difference | p-value |
|---|---|---|---|---|
| Weight and birth weight by week | SGA | AGA | -1.77 | 0.003 |
| Weight and birth weight by week | SGA | LGA | -2.17 | 0.004 |
| Weight and severity of heart disease | Group 3 (Severity of heart disease ) | Group 1 (Severity of heart disease ) | -2.61 | 0.007 |
| Weight and severity of heart disease | Group 3 (Severity of heart disease ) | Group 2 (Severity of heart disease ) | -2.84 | 0.003 |
| Height and mother's education | A diploma and an associate degree | Below diploma | 0.788 | 0.01 |
| Height and severity of heart disease | Group 3 (Severity of heart disease ) | Group 2 (Severity of heart disease ) | -1.61 | 0.036 |
| Arm circumference and father's education | Bachelor's and master's degree | Below diploma | 6.16 | 0.029 |
| Arm circumference and father's education | Bachelor's and master's degree | Diploma and above | 5.78 | 0.039 |
| Income and Vitamin A | 2-4 million | No income | 0.032 | 0.045 |
| Income and Q10 | Above 4 million | Below 1 million | 0.179 | 0.045 |
| Income and Q10 | Above 4 million | 1-2 million | 0.186 | 0.028 |
After describing the qualitative variables, the differences in the mean Z-scores for weight, height, head circumference, and arm circumference across age groups were examined. For this purpose, a one-way ANOVA (analysis of variance) test was conducted, and the results are as follows. It is worth noting that after assessing the P-value in the mean difference tests and determining their significance, a post-hoc Scheffe test was performed. The one-way ANOVA table shows a significant difference in the means of weight and birth weight across weeks. Further analysis revealed that the difference is significant (p < 0.002). Significant differences were also found between the means of other variables in this study, including weight and severity of heart disease (p < 0.003), weight and mother's occupation (p < 0.000), height and birth weight by week (p < 0.048), height and syndrome (p < 0.006), height and mother's education (p < 0.008), height and mother's occupation (p < 0.018), height and severity of heart disease (p < 0.031), head circumference and syndrome (p < 0.003), head circumference and mother's education (p < 0.000), arm circumference and father's education (p < 0.022), arm circumference and the two groups of Vitamin A and income (p < 0.021), and Q10 and income (p < 0.024) (Table 5).
As mentioned, after examining the significance of the mean differences and confirming their significance, a post-hoc test was conducted. This test is performed after the significance of the F-test in one-way ANOVA to determine which specific groups or categories differ significantly.
Scheffé post-hoc test was used to investigate the differences between groups. The results showed: The mean Z-score of weight for birth weight by week in the SGA group (-2.80 ± 3.5) was significantly lower than in the AGA group (-1.02 ± 1.39) (p < 0.003). The mean Z-score of weight for birth weight by week in the SGA group (-2.80 ± 3.5) was significantly lower than in the LGA group (-0.62 ± 1.55) (p < 0.004). The mean Z-score of weight for severity of heart disease in group 3 (-3.75 ± 1.31) was significantly lower than in group 1 (-1.14 ± 1.90) (p < 0.007) and group 2 (-0.143 ± 1.32) (p < 0.003). The mean Z-score of height for mother’s education in the diploma and associate degree group (0.032 ± 1.22) was significantly higher than in the below-diploma group (-0.756 ± 1.29) (p < 0.010). The mean Z-score of height for severity of heart disease in group 3 (-1.76 ± 1.44) was significantly lower than in group 2 (-0.143 ± 1.32) (p < 0.036). The mean Z-score of arm circumference for father’s education in the bachelor’s and master’s group (21.08 ± 15.16) was significantly higher than in the below-diploma group (14.92 ± 1.62) (p < 0.029) and the diploma and associate degree group (15.30 ± 1.54) (p < 0.039). The mean Vitamin A level in the 2–4 million income group (0.346 ± 0.024) was significantly higher than in the no-income group (0.313 ± 0.04) (p < 0.045). The mean Q10 level in the above-4-million income group (0.930 ± 0.361) was significantly higher than in the below-1-million income group (0.75 ± 0.066) (p < 0.045) and the 1–2 million income group (0.74 ± 0.092) (p < 0.028).
3.1. Examination of the Relationship Between Z-Scores (Weight, Height, Head Circumference, Arm Circumference) in Cyanotic and Non-cyanotic Patients
Statistical analysis showed no significant relationship between anthropometric measures and the two groups of cyanotic and non-cyanotic patients. Pearson's test and significance levels confirmed this: the Z-score for height in cyanotic and non-cyanotic cases was -0.085 (p < 0.344) and -0.120 (p < 0.177), respectively. Pearson's value for weight Z-score in cyanotic and non-cyanotic cases was -0.139 (p < 0.119) and 0.143 (p < 0.110), respectively. Pearson's correlation coefficient for head circumference Z-score between cyanotic and non-cyanotic cases was 0.081 (p < 0.735) and -0.106 (p < 0.656), respectively. Pearson's value for arm circumference Z-score in cyanotic and non-cyanotic cases was 0.096 (p < 0.476) and -0.063 (p < 0.640), respectively.
3.2. Examination of the Relationship Between Z-scores (Weight, Height, Head Circumference, Arm Circumference) in High Flow and Low Flow Cyanotic Patients
No significant relationship was found between cyanotic cases (divided into High Flow and Low Flow) and anthropometric measures. Pearson's test results: Pearson's value for height Z-score in High Flow and Low Flow cases was -0.031 (p < 0.725) and -0.075 (p < 0.401), respectively. Pearson's value for weight Z-score in High Flow and Low Flow cases was -0.071 (p < 0.429) and -0.114 (p < 0.202), respectively. Pearson's correlation coefficient for head circumference Z-score between High Flow and Low Flow cases was -0.096 (p > 0.686) and 0.140 (p > 0.556), respectively. Pearson's value for arm circumference Z-score in High Flow and Low Flow cases was 0.081 (p < 0.551) and 0.058 (p < 0.667), respectively.
3.3. Examination of the Difference in Mean Z-scores (Weight, Height, Head Circumference, Arm Circumference) Between Surgically Treated and Non-surgically Treated Groups
After examining the difference in mean Z-scores of weight, height, head circumference, and arm circumference between surgically treated and non-surgically treated groups, it was found that: For weight and height, with P-values of 0.053 and 0.215, respectively, there was no significant difference between the two groups. For head circumference and arm circumference, with P-values of 0.227 and 0.620, respectively, there was no significant difference between the two groups.
3.4. Examination of the Difference in Mean Z-scores (Weight, Height, Head Circumference, Arm Circumference) by Type of Surgery
After examining the differences in mean Z-scores for weight and height by type of surgery, with P-values of 0.154 and 0.907, respectively, no significant difference was found between the types of surgery. Similarly, for head circumference and arm circumference, with P-values of 0.931 and 0.183, respectively, there was no significant difference.
4. DISCUSSION
This study aimed to assess the nutritional status of children with CHD. From a pathophysiological and conceptual perspective, malnutrition in children with CHD is widely understood as the result of a complex imbalance between increased metabolic demands and insufficient nutritional intake. Factors such as chronic hypoxia, elevated resting energy expenditure, recurrent respiratory infections, feeding fatigue, and impaired gastrointestinal absorption have been consistently identified as central mechanisms contributing to growth faltering in this population [17, 26, 36]. Within this framework, our findings demonstrate significant associations between the clinical severity of heart disease and anthropometric deficits, particularly in weight and height indices, underscoring the role of disease burden in shaping nutritional vulnerability among children with CHD. Similar mechanisms have been described in previous studies, in which greater heart failure severity and prolonged disease duration were associated with poorer growth outcomes [14, 43].
The findings of this study revealed no significant difference in anthropometric measures between children who underwent surgery (surgery group) and those who did not (non-surgery group). However, notable associations were found between current weight and gestational weight, cardiac failure severity and mother’s job, height and gestational weight, cardiac failure severity and height, syndrome and height, mother’s education and height, mother’s job and height, head circumference and syndrome, head circumference and maternal education, and arm circumference and father's education. The present study indicates that children with CHD are at risk of experiencing severe malnutrition and growth failure. In a study in Northern Europe by Bejiqi et al. (2017), 23% of children with CHD showed nutritional problems [44]. However, in the present study, 33.9% of children had poor appetite, which is not in alignment with Bejiqi’s study. Furthermore, a study conducted by Silva et al. in 2007 identified significant variables associated with malnutrition through logistic regression models.
These variables included sex, type of heart disease, birth weight, birth length, subscapular thickness, triceps thickness, and cephalic circumference [45].
Vaidyanathan et al. (2008) investigated pediatric malnutrition in CHD and reported a significant association between the father's level of education and malnutrition [41]. This finding corresponds to our current study.
In a case-control study conducted in Iran in 2010, involving 400 children aged 3 to 16 years with CHD, it was observed that patients with cardiac problems are susceptible to experiencing growth impairment. This risk was particularly higher among cyanotic patients, where increased pulmonary arterial pressure contributed to more severe and prevalent growth disturbances [19]. Multiple studies have reported a common occurrence of delayed growth in cyanotic patients. However, the severity of the underlying acyanotic disorders, the duration of the illness, and the prevailing pattern of malnutrition in the specific geographic area have also been identified as potential factors influencing this relationship [46].
None of the patients in our study exhibited edematous malnutrition, which is also not commonly mentioned in other reports concerning children with CHD. Regarding age-related differences, infants in our study had a higher prevalence of acute malnutrition, as indicated by higher rates of inappropriate weight gain, compared with children aged 1 to 5 years. This finding is consistent with the results reported by Venugopalan [47] and da Silva [45], suggesting that infants rely more heavily on caregivers to meet their nutritional needs, potentially contributing to their heightened vulnerability to malnutrition compared to older children [48]. Similarly, Okoromah [43] identified younger age as a significant predictor of undernutrition within their patient cohort. Consistent with our findings, a study by Ratanachu- Ek et al. (2011) found that 40% of pediatric patients with CHD were malnourished. Additionally, they found that cardiac surgery had a significant positive impact on weight gain and nutritional status [49]. These findings emphasize the importance of targeting infants to improve nutritional intake and ensure effective medical management, particularly before the availability or accessibility of surgical intervention.
It is worth noting that gender disparities in the occurrence and severity of malnutrition have been acknowledged; however, the results obtained from different regions are inconsistent. Some areas report males as more affected, while others indicate a predominance of females [43]. Growth limitation remains a persistent issue among patients with CHD. Early nutritional screening upon diagnosis plays a crucial role in mitigating growth impairment, expediting nutritional interventions, and ultimately improving patients' overall health status.
However, findings from a prospective cohort study conducted by Costello et al. (2015) in Australia were inconsistent. Among 78 children with CHD, a significant number exhibited growth limitation indicated by Z-scores below 2 for multiple growth parameters, including weight/height, height/age, and weight/height Z-score [50]. In contrast, our study, involving 127 patients, found that only the Z-score for height was less than or equal to -2, with 31 cases displaying Z-scores below 2, deviating from the aforementioned study's findings.
Furthermore, an additional case-control study performed by Hassan et al. (2015) in France examined 100 children with and a control group of healthy children. They discovered that 84% of patients in the case group and 20% in the control group were malnourished. Anthropometric measures and biochemical markers of nutritional status were significantly lower in the case group compared to the control group [48]. They concluded that malnutrition is prevalent among children with CHD and can be predicted by low levels of hemoglobin, reduced arterial oxygen saturation, cardiac failure, elevated pulmonary arterial pressure, and poor nutritional history, which aligns with our findings.
In another case-control study by Okoromah et al. (2011), it was concluded that severe malnutrition, in conjunction with anemia and moderate to severe congestive heart disease (CHF), was highly prevalent among children with CHD prior to surgery [43]. In line with our investigations, Arodiwe et al. (2015) conducted a study focusing on the nutritional status, burden, and determinants of malnutrition in patients with CHD in Nigeria [51]. Their findings revealed that children with CHD experienced severe malnutrition and growth failure. They identified mean age at presentation and age-appropriate dietary adequacy as significant contributing factors to this outcome. Despite these findings, the precise predictive factors for growth deficiency and nutritional status in children with CHD remain unclear. Presently, the World Health Organization recommends using the Z-score or standard deviation (SD) system to assess and classify undernutrition [52, 53]. Employing this method, all three indices are measured, and the results are expressed in terms of Z-scores or standard deviation units, providing a distinct advantage over alternative methodologies [53, 54].
CONCLUSION
The findings of this study indicate that children with CHD are at increased risk of malnutrition, particularly with respect to weight and height parameters. Significant associations were observed between nutritional status, disease severity, and selected demographic characteristics. Following diagnosis, targeted nutritional interventions are recommended to mitigate the risk of malnutrition and facilitate the attainment of optimal weight and height.
LIMITATIONS OF THE STUDY
The study used convenience sampling, which may introduce selection bias and limit the generalizability of the findings to the broader population of children with CHD. The sample size of 127 children may not be sufficient to capture the full spectrum of CHD cases, especially given the diversity in the severity and types of CHD. Additionally, the sample was limited to a single region (northeastern Iran), which may not represent the broader population of children with CHD globally or even nationally. The study's descriptive-analytical design only provides a snapshot of the relationship between variables at a single point in time. It cannot establish causality or track changes in nutritional status over time. Some data, such as demographic information, may rely on self-reporting by parents or caregivers, which can introduce recall bias or inaccuracies. The study did not include a control group of healthy children or children with other chronic conditions for comparison, making it difficult to determine whether the observed nutritional deficiencies are specific to CHD or common in other chronic illnesses. The study primarily focused on anthropometric indicators and Z-scores. It did not include a comprehensive assessment of dietary intake, micronutrient levels, or other biochemical markers of malnutrition, which could provide a more complete picture of nutritional status. The study was conducted in northeastern Iran, where cultural, socioeconomic, and healthcare access factors may differ from those in other regions. These factors could influence nutritional status and limit the generalizability of the findings. The study did not follow up with participants over time to assess the long-term impact of nutritional interventions or the progression of malnutrition in children with CHD. The study did not account for potential confounding factors such as socioeconomic status, access to healthcare, or parental nutritional knowledge, which could influence both the severity of CHD and nutritional outcomes. The study included children visiting a specific hospital and clinics, which may not represent the broader population of children with CHD, including those who do not seek or have access to specialized care. The study does not account for regional dietary habits or cultural practices that may influence nutritional status, which could limit the applicability of the findings to other populations. The study was unable to assess micronutrient and vitamin levels due to prohibitively high costs.
RECOMMENDATIONS FOR FUTURE RESEARCH
Future studies should include larger and more diverse samples of children with CHD from various regions to enhance the generalizability of findings. Conducting longitudinal studies would allow researchers to track changes in nutritional status and anthropometric indicators over time, providing insights into causal relationships and the long-term effects of interventions. Including control groups of healthy children or those with other chronic conditions would facilitate comparative analyses and clarify the specific impacts of CHD on nutritional status. Expanding nutritional evaluations to assess dietary intake, serum levels of micronutrients and vitamins, and qualitative measures could provide a more holistic understanding of children’s nutritional status. Future research should also identify and control for potential confounding factors such as socioeconomic status, parental education, access to healthcare services, and cultural dietary practices to improve the accuracy of findings. Follow-up studies are recommended to evaluate how changes in healthcare practices or nutritional guidelines affect the nutritional status of children with CHD. Finally, involving parents and caregivers in the study design can provide valuable insights into their perceptions, challenges, and needs regarding the management of their children’s nutritional requirements.
AUTHORS' CONTRIBUTIONS
The authors confirm their contribution to the paper as follows: H.M.: Involved in the literature search, data collection, and manuscript writing; S.T., H.B., S.S.G., and B.I.: Involved in study design, supervision of data collection, and drafting the manuscript; B.A.: Involved in data analysis and drafting the manuscript; M.N. and R.R.: Involved in study design and manuscript drafting. All authors read, revised, and approved the final manuscript.
LIST OF ABBREVIATIONS
| CHD | = Congenital Heart Disease |
| CHF | = Congenital Heart Failure / Chronic Heart Failure (context-dependent) |
| FTT | = Failure to Thrive |
| IUGR | = Intrauterine Growth Restriction |
| AGA | = Appropriate for Gestational Age |
| SGA | = Small for Gestational Age |
| LGA | = Large for Gestational Age |
| VSD | = Ventricular Septal Defect |
| MS | = Mitral Stenosis |
| TOF | = Tetralogy of Fallot |
| TAPVC | = Total Anomalous Pulmonary Venous Connection |
| WHO | = World Health Organization |
| BMI | = Body Mass Index |
| WAZ | = Weight-for-Age Z-score |
| WHZ | = Weight-for-Height Z-score |
| HAZ | = Height-for-Age Z-score |
| SpO2 | = Peripheral Capillary Oxygen Saturation |
| SD | = Standard Deviation |
| SPSS | = Statistical Package for the Social Sciences |
| OR | = Odds Ratio |
| CI | = Confidence Interval |
| P-value (P) | = Probability Value (statistical significance indicator) |
| Q10 | = Coenzyme Q10 |
ETHICS APPROVAL AND CONSENT TO PARTICIPATE
The study was approved by the Mashhad University of Medical Sciences (IR.MUMS.FM.REC.1395.349)
HUMAN AND ANIMAL RIGHTS
All procedures performed in studies involving human participants were in accordance with the ethical standards of institutional and/or research committee and with the 1975 Declaration of Helsinki, as revised in 2013.
CONSENT FOR PUBLICATION
Informed consent was obtained from the parents or legal guardians of the children.
AVAILABILITY OF DATA AND MATERIALS
The data that support the findings of this study are available from the corresponding author upon reasonable request.
ACKNOWLEDGEMENTS
Declared none.

