All published articles of this journal are available on ScienceDirect.

Burden of Depressive Disorders in Indonesia: Trends and Spatiotemporal Analysis of DALYs Lost by Gender and Age, 1990–2021
Abstract
Background and Purpose
Depressive disorders are an increasing public health concern in Indonesia, with rising trends and widening regional disparities. This study aims to analyze the burden of depressive disorders by assessing temporal trends and spatiotemporal patterns of disability-adjusted life years (DALYs) lost across gender and age groups from 1990 to 2021.
Materials and Methods
Data were obtained from the Global Burden of Disease (GBD) 2021 study conducted by the Institute for Health Metrics and Evaluation (IHME) using the GBD data wrapper. Joinpoint trend analysis was used to estimate the Annual Percent Change (APC) in DALYs lost across three age groups (<20, 20–54, ≥55 years) and by gender. Spatiotemporal analysis compared the provincial distribution of DALYs lost in 1990, 2019, and 2021 to capture patterns before and during the COVID-19 pandemic.
Results
DALYs lost due to depressive disorders increased across all age groups over the study period, with the sharpest rise observed in those aged <20 years between 2019 and 2021. Spatiotemporal mapping indicated widening provincial disparities, with particularly high burdens among females in Aceh, North Sumatra, Kalimantan, and Papua. The 20–54 age group consistently contributed the largest proportion of DALYs lost, while both younger and older populations also showed increasing trends.
Discussion
These findings suggest that Indonesia’s growing and uneven depressive disorder burden reflects persistent gaps in mental health service access, early detection, and targeted interventions. The pronounced disparities across gender, age, and provinces highlight the need for more equitable, data-driven mental health planning and resource allocation.
Conclusion
Depressive disorders in Indonesia continue to rise, with widening regional disparities and the greatest burden observed among females and the working-age population.
1. INTRODUCTION
Mental health refers to a condition of psychological well-being that allows individuals to manage life’s pressures, understand their strengths, learn and function effectively, work efficiently, and participate meaningfully in society [1]. Poor mental health and mental illness are not the same. A person can have diminished mental well-being even without a clinical diagnosis. On the other hand, someone living with a mental disorder may still experience times of good physical, psychological, and social health [2].
Findings from the Global Burden of Disease Study 2019 indicate that the global number of individuals living with mental disorders increased from 654.8 million (12,579.3 per 100,000 population) in 1990 to 970.1 million (12,262.0 per 100,000 population) in 2019 [3]. Prevalence varied across regions, with Central Europe, Eastern Europe, and Central Asia reporting 10,517.2 cases per 100,000 population; South Asia reporting 13,106.0; Southeast Asia, East Asia, and Oceania reporting 10,520.4; Sub-Saharan Africa reporting 11,934.6; South America reporting 13,056.6; and Latin America and the Caribbean reporting 13,804.2 per 100,000 population. The burden of mental disorders has increased over time and differs across regions, reflecting variation in mental health service availability.
Mental disorders are associated with more severe illness, increased healthcare costs, and an elevated risk of suicidal ideation.These conditions are associated with considerable economic costs, rising with greater clinical severity [4]. Mental disorders have been associated with poorer survival among patients with cancer. For instance, individuals with malignant gastrointestinal cancers who do not have accompanying mental illness typically survive around 52 months, whereas those with comorbid mental disorders have an average survival of about 43 months [5]. Individuals with a previous mental disorder diagnosis are at a higher risk of experiencing suicidal thoughts [6]. Consistent evidence shows that mental disorders are linked to a higher likelihood of suicide [7]. In addition, individuals in the general population who have mental illnesses are more likely to experience victimization in the future [8].
According to the Global Burden of Disease Study 2021 (GBD 2021), based on data retrieved from the Global Health Data Exchange (GHDx), anxiety and depressive disorders accounted for the highest proportions of disability-adjusted life years (DALYs) both globally and in Indonesia. In 2021, the age-standardized DALY rate for major depressive disorder globally was 713.82 per 100,000 population, whereas in Indonesia, the corresponding rate was considerably lower at 458.85 per 100,000 population [9]. These findings underscore both the global dominance of anxiety and depressive disorders in mental health burden and notable inter-country differences, highlighting the necessity for country-specific mental health strategies and resource allocation.
Depressive disorders are characterized by persistent sadness, loss of interest or pleasure, feelings of guilt or low self-worth, disturbed sleep or appetite, fatigue, and poor concentration. Depression may persist over time or recur, affecting an individual’s ability to perform at work or school and to manage everyday activities. Severe depressive episodes are also associated with an increased risk of suicide [10]. A previous study concluded that depressive disorders are a major individual-level risk factor for suicide [11].
Previous research has also revealed a spatial association between mental health and various factors, including housing quality, sanitation, income, environmental health knowledge, education, age, gender, protection from flooding, and specific characteristics of the natural environment [12]. Epidemiological analysis of the spatial distribution of DALYs lost due to depressive disorders can provide insights into regional differences in disease burden.
Determining the geographic distribution of mental disorders is valuable for epidemiological research and health service planning. This information is essential for resource allocation and organizing healthcare delivery. The use of territorial and spatial analysis to identify mental disorders in specific areas is increasingly prevalent and can contribute to improvements in population genetics research, prevalence mapping, health indicators, mental health service provision, and financing [13]. Policymakers are reported to consider spatial and demographic factors in allocating healthcare resources for suicide prevention [14]. At the national level, demographic and geographic characteristics are increasingly considered in health service planning and program implementation.
Global research on depressive disorder burden is extensive, but studies focusing on Indonesia are still limited.Most national studies have focused on prevalence, symptom patterns, or particular groups, but few have looked at the long-term impact, such as Disability-Adjusted Life Years (DALYs). Moreover, previous research in Indonesia has largely focused on either anxiety disorders or cross-sectional snapshots, without integrating longitudinal trend analysis, spatiotemporal patterns, and stratification by age and gender at the provincial level. There is still little clear evidence showing how depression affects various demographic groups and regions in Indonesia over the years.
It is still unclear whether the rise in depression during the COVID-19 pandemic is just a continuation of previous trends or something new and faster than before. Understanding pre-pandemic trajectories is essential for contextualizing post-2019 increases and avoiding over-attribution of changes solely to the pandemic period. Checking the trends before 2020 helps us see if the recent jump in depression-related DALYs is bigger than what past trends would predict.
This study advances existing knowledge beyond routine Global Burden of Disease (GBD) reporting in several important ways. First, rather than presenting descriptive burden estimates alone, we apply joinpoint regression to identify temporal shifts and inflection points in DALYs for depressive disorder over a 31-year period, enabling clearer distinction between long-term trends and recent changes. Second, the spatiotemporal analysis at the provincial level reveals subnational heterogeneity that is not readily apparent in national GBD summaries, highlighting provinces and demographic groups with disproportionate and rapidly increasing burdens. Third, by explicitly comparing pre-pandemic and pandemic periods, this study provides policy-relevant insights into how the COVID-19 pandemic may have altered the trajectory of depressive disorder burden in Indonesia. Together, these findings provide evidence relevant to each context to support mental health planning for specific needs and how resources are distributed, both across the country and within provinces.
This study aims to analyze the burden of depressive disorders in Indonesia by examining the trends and spatiotemporal patterns of DALYs lost across gender and age groups from 1990 to 2021. The findings are expected to inform targeted, gender- and age-specific mental health interventions and resource allocation across Indonesian provinces.
2. MATERIALS AND METHODS
2.1. Study Design and Data Source
This study employed an observational, analytical quantitative design using population-level health data from all 34 provinces in Indonesia. Data on the burden of depressive disorders, measured in disability-adjusted life years (DALYs) lost, were obtained from the Global Burden of Disease Study 2021 (GBD 2021) conducted by the Institute for Health Metrics and Evaluation (IHME), which provides comprehensive age- and sex-stratified estimates from 1990 to 2021 for trend and spatiotemporal analysis. Data selection followed predefined inclusion and exclusion criteria to ensure consistency and comparability across provinces. Only provincial-level DALYs estimates with complete reporting across all study years and with stratification by sex (male, female) and age groups (<20, 20–54, ≥55 years) were included. Provinces with missing or incomplete DALY values, lacking sex or age-specific breakdowns, or showing unresolved inconsistencies in the GBD dataset were excluded. Individual-level or clinical data were not part of the analysis, as the study relied entirely on population-based estimates from the GBD.
2.2. Sample Size Consideration
The unit of analysis in this ecological study was the province, not individual participants. The sample size included all 34 provinces of Indonesia, covering all administrative units with available data in the GBD database. No sampling procedure was conducted because the study used complete population-level provincial estimates. Conventional sample size calculations or statistical power analyses for individual-level studies were not applicable. Including all provinces provided full national coverage and allowed the identification of temporal and spatial patterns in the burden of depressive disorders.
2.3. Measurements
This study analyzed the burden of depressive disorders using age- and sex-specific percentages of disability-adjusted life years (DALYs) lost, obtained from the Global Burden of Disease Study 2021 (GBD 2021). The analysis was conducted across four age categories: (1) youth (<20 years), (2) working-age adults (20–54 years), (3) older adults (≥55 years), and (4) all ages combined. For each age group, the data were further stratified by sex: (a) male, (b) female, and (c) both sexes combined. The percentage of DALYs lost was calculated by dividing the DALYs attributable to depressive disorders by the total DALYs from all causes, and multiplying by 100. This standardized metric allowed for comparison of the relative burden of depression across different demographic groups and geographic regions in Indonesia.
2.4. Statistical Analysis
This study analyzed the temporal dynamics of depressive disorder burden in Indonesia from 1990 to 2021 using the Joinpoint Regression software to identify trend inflection points. DALYs lost were modeled by age groups (<20, 20–54, ≥55, and all ages) and sex, with annual percentage change (APC) and average annual percentage change (AAPC) calculated for each trend segment, using Monte Carlo permutation tests for significance (p<0.05). Spatiotemporal patterns were visualized using Datawrapper, producing thematic maps for 1990, 2019, and 2021 to highlight provincial differences in DALYs lost across age groups and sex.
3. RESULTS
3.1. Trends Analysis
From 1990 to 2021, disability-adjusted life years (DALYs) lost due to depressive disorders in Indonesia showed a consistent upward trend, with clear variation across age groups and sexes. In the total population (all sexes, all ages), DALYs lost increased steadily over the study period, with an average annual percent change (AAPC) of 2.14% (95% CI: 1.78–2.50; p<0.001). A brief stagnation was observed in the early 2000s, followed by a sustained increase until 2021.
As summarized in Table 1, gender differences were evident across all age groups. Females consistently exhibited higher DALYs lost and a stronger long-term increasing trend compared with males, with an overall AAPC of 2.18%. Both males and females aged under 20 years experienced substantial increases during the period 2019–2021.
| Sex | Age | Trend 1 | Trend 2 | Trend 3 | Trend 4 | Trend 5 |
Average APC (AAPC) |
|||||||||||
|---|---|---|---|---|---|---|---|---|---|---|---|---|---|---|---|---|---|---|
| Year |
APC (CI95%) |
P-value | Year |
APC (CI95%) |
P-value | Year |
APC (CI95%) |
P-value | Year |
APC (CI95%) |
P-value | Year |
APC (CI95%) |
P-value | 1990-2021 | P-value | ||
| Male | < 20 | 1990-2000 | 4.01* (3.43-5.33) |
< 0.001 | 2000-2004 | 0.16 (-2.23-2.68) |
0.800 | 2004-2019 | 4.44* (3.94-5.23) |
0.012 | 2019-2021 | 23.77* (16.14-27.58) |
< 0.001 | - | - | - | 4.88* (4.48–5.29) | <0.001 |
| 20 - 54 | 1990-2012 | 0.60* (0.41-0.72) |
0.002 | 2012-2021 | 1.77* (1.29-3.15) |
< 0.001 | - | - | - | - | - | - | - | - | - | 0.94* (0.82–1.06) | <0.001 | |
| 55 + | 1990-1997 | 0.44* (0.16-0.79) |
0.026 | 1997-2004 | -0.66* (-1.46--0.34) |
0.038 | 2004-2010 | 0.52 (-0.37-0.99) |
0.142 | 2010-2019 | 1.31* (1.14-1.81) |
< 0.001 | 2019-2021 | -6.13* (-7.25--5.29) |
< 0.001 | 0.02 (-0.04–0.08) | 0.521 | |
| All ages | 1990-1996 | 3.36* (2.17-6.93) |
< 0.001 | 1996-2021 | 1.84* (1.17-1.96) |
0.043 | - | - | - | - | - | - | - | - | - | 2.13* (1.94 - 2.33) | <0.001 | |
| Female | < 20 | 1990-2001 | 3.49* (1.91-13.12) |
0.02 | 2001-2004 | -1.31 (-3.84-9.77) |
0.901 | 2004-2019 | 5.07 (-2.13-6.72) |
0.155 | 2019-2021 | 22.65* (7.96-30.36) |
< 0.001 | - | - | - | 4.92* (4.29–5.55) | <0.001 |
| 20 - 54 | 1990-2010 | 0.74 (-0.23-1.04) |
0.069 | 2010-2021 | 2.23* (1.44-5.52) |
0.008 | - | - | - | - | - | - | - | - | - | 1.26* (1.05–1.48) | <0.001 | |
| 55 + | 1990-2004 | -0.36* (-0.7--0.23) |
0.012 | 2004-2010 | 0.59 (-0.12-1.62) |
0.101 | 2010-2019 | 2.16* (1.96-2.91) |
< 0.001 | 2019-2021 | -1.45 (-3.04-0.2) |
0.08 | - | - | - | 0.48* (0.38–0.58) | <0.001 | |
| All ages | 1990-2011 | 1.87 (-0.34-6.73) |
0.066 | 2011-2021 | 2.83 (-1.35-6.54) |
0.060 | - | - | - | - | - | - | - | - | - | 2.18* (1.92 - 2.44) | <0.001 | |
Age-specific analysis indicated that adolescents (<20 years) experienced the most pronounced increase, particularly during 2019–2021 (APC of 23.40%) (Table 2).
| Age | Trend 1 | Trend 2 | Trend 3 | Trend 4 | Trend 5 |
Average APC (AAPC) |
|||||||||||
|---|---|---|---|---|---|---|---|---|---|---|---|---|---|---|---|---|---|
| Year |
APC (CI95%) |
P-value | Year |
APC (CI95%) |
P-value | Year |
APC (CI95%) |
P-value | Year |
APC (CI95%) |
P-value | Year |
APC (CI95%) |
P-value | 1990-2021 | P-value | |
| < 20 | 1990-2000 | 3.83* (2.71-6.67) |
0.003 | 2000-2004 | -0.11 (-3.06-7.09) |
0.96 | 2004-2019 | 4.68 (-0.37-5.86) |
0.059 | 2019-2021 | 23.40* (12.48-28.43) |
< 0.001 | - | - | - | 4.88* (4.45–5.32) | <0.001 |
| 20 - 54 | 1990-2011 | 0.64* (0.17-0.85) |
0.025 | 2011-2021 | 2.00* (1.32-4.32) |
0.002 | - | - | - | - | - | - | - | - | - | 1.08* (0.92–1.23) | <0.001 |
| 55 + | 1990-1996 | 0.27 (-0.04-0.94) |
0.078 | 1996-2004 | -0.56* (-1.51--0.32) |
0.025 | 2004-2010 | 0.49 (-0.16-1.28) |
0.107 | 2010-2019 | 1.70* (1.52-2.23) |
< 0.001 | 2019-2021 | -3.89* (-5.21--1.92) |
< 0.001 | 0.24* (0.19–0.29) | <0.001 |
| All ages | 1990-2001 | 2.57 (1.86-4.12)* |
0.018 | 2001-2004 | -0.29 (-1.38-3.1) |
0.873 | 2004-2021 | 2.30* (1.76-3.73) |
0.041 | - | - | - | - | - | - | 2.14* (1.78 - 2.5) | <0.001 |
In contrast, the 20–54 year age group exhibited a more moderate increase during the same period, consistent with its overall steady long-term trend (AAPC of 1.08%), while continuing to contribute the largest proportion of total DALYs lost. In comparison, older adults (≥55 years) demonstrated more fluctuating patterns with a slower overall increase (AAPC of 0.24%).
Figure 1 illustrates long-term trends in DALYs lost across age groups and sex. Across all sexes combined, the 20–54 year age group consistently accounted for the highest burden, while the <20 year group exhibited the steepest relative increase during the later years of the observation period. DALYs lost among individuals aged ≥55 years remained comparatively stable, with a modest increase observed after 2015. Similar patterns were observed when stratified by sex, although females consistently showed higher levels of DALYs lost than males across all age groups.
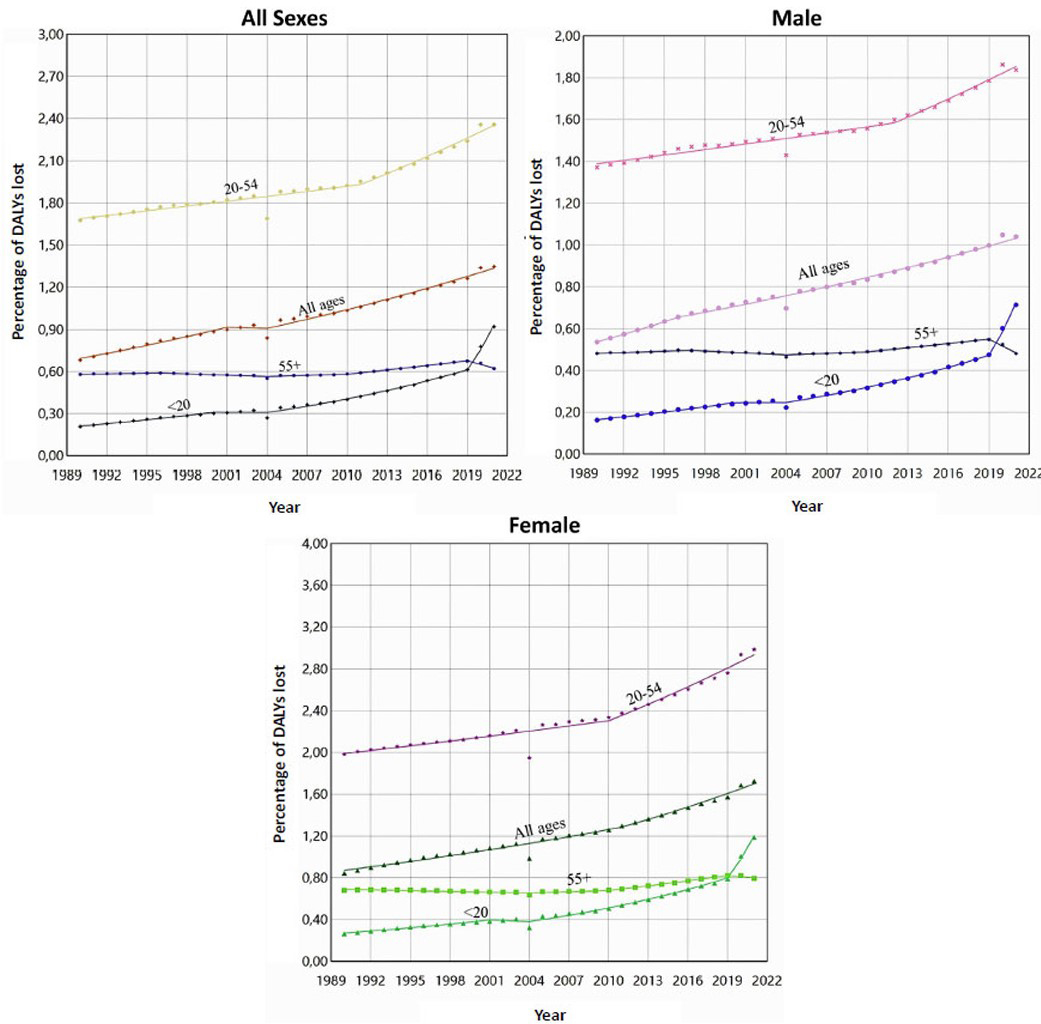
Trends in DALYs lost due to depression, 1990-2021.
3.2. Spatiotemporal Analysis
Spatiotemporal mapping revealed substantial changes in the provincial distribution of DALYs lost due to depressive disorders between 1990 and 2019, and 2021 (Fig. 2). In 1990, DALYs lost were relatively evenly distributed across provinces, with generally lower values. By 2019, higher burdens emerged in several provinces, particularly among females in Aceh, North Sumatra, Kalimantan, and Papua.
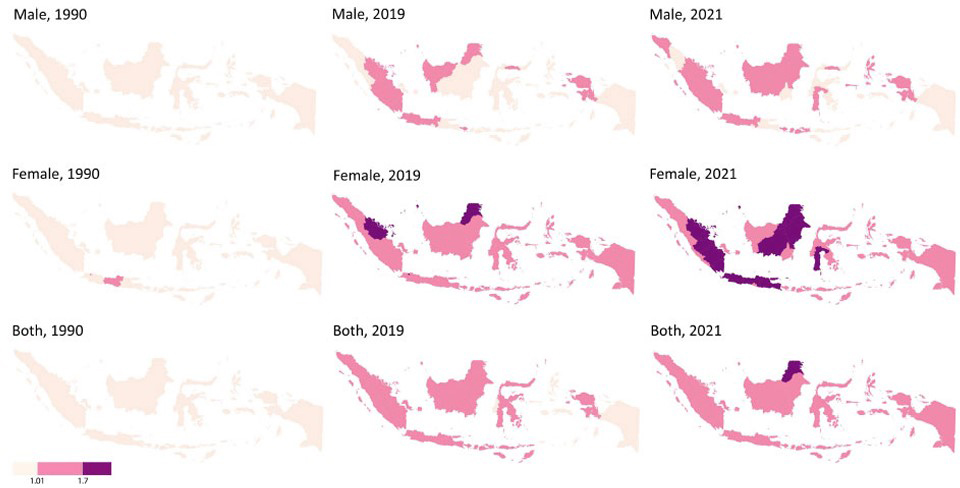
Spatiotemporal DALYs lost due to depression by sex.
These disparities became more pronounced in 2021, with sharper contrasts observed between provinces. While DALYs lost increased among both sexes, female populations consistently exhibited higher values across high-burden provinces, indicating widening interprovincial and gender-related disparities over time.
Age-stratified maps further demonstrated heterogeneity in spatial patterns. Among individuals aged under 20 years, DALYs lost remained relatively low across most provinces, with modest increases observed in a limited number of regions by 2021 (Fig. 3). In contrast, the 20–54 year age group showed consistently higher DALYs lost across nearly all provinces, with widespread intensification between 1990 and 2021. For those aged ≥55 years, provincial patterns remained relatively stable until 2019, followed by a noticeable increase in several regions by 2021.
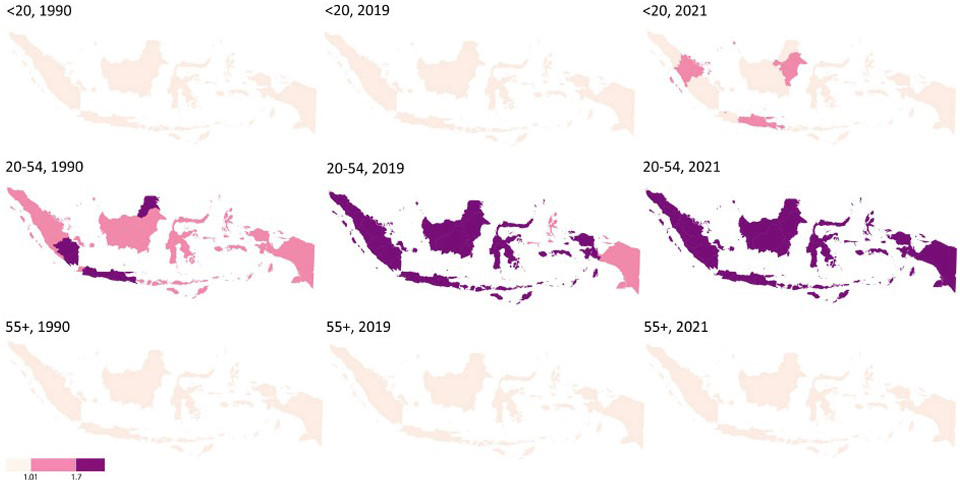
Spatiotemporal DALYs lost due to depression by age.
Overall, the spatiotemporal analysis indicates that the working-age population (20–54 years) consistently accounts for the highest levels of DALYs lost due to depressive disorders across Indonesian provinces.
4. DISCUSSION
This discussion summarizes the main findings and places them in the context of previous research, while noting the study’s descriptive and ecological design. Since this study draws on secondary, population-level GBD data, the findings are intended to provide contextual understanding rather than establish causal relationships. Observed temporal and spatial patterns should therefore be understood as reflecting broader population trends, and the proposed social, demographic, and pandemic-related factors are presented as plausible explanations that warrant further investigation using individual-level or mixed-methods research.
The DALYs lost due to depression in Indonesia have shown a significant upward trend from 1990 to 2021, with a sharp spike during 2019–2021 coinciding with the COVID-19 pandemic. This increase may reflect social and economic disruptions, limited access to mental health services, and increased social isolation associated with the pandemic, although these factors were not directly examined in this study. Studies have reported that around 30.5% of Indonesians experienced symptoms of depression during the pandemic, with higher prevalence among women and younger age groups [15, 16]. Even prior to the pandemic, the burden of DALYs lost due to depression had been rising, particularly among women and the productive-age population, which may be influenced by occupational stress, urbanization, and shifts in social structures [17].
Globally, this pattern is consistent, with data indicating an increase of more than 1.8-foldin DALYs lost due to depression since 1990, peaking in 2020–2021 during the pandemic [18]. The rising burden of depression in Indonesia likely reflects not only an increase in cases but also better health system capacity and greater public awareness of mental health. Greater awareness has been shown to reduce stigma toward individuals with mental disorders, leading to broader identification and reporting of depressive cases [19, 20]. Thus, the observed rise in DALYs lost likely represents a combination of increasing disease burden and improved detection and reporting, rather than a single underlying cause.
The rise in DALYs lost due to depression among people under 20 years old may relate to biological and psychosocial vulnerabilities, as well as rapid social changes and greater exposure to digital media. Adolescents today face greater exposure to negative online content and cyberbullying, both of which have been linked in prior research to mental health problems. Excessive social media use among adolescents has been reported to be significantly associated with mental health disorders [21]. Similarly, children and adolescents navigating complex digital environments without adequate emotional support are at higher risk of worsening psychological conditions [22].
The COVID-19 pandemic may have amplified these challenges, with school closures, prolonged social restrictions, and extended online learning contributing significantly to mental health burdens in adolescents. Studies have shown that the prevalence of depression among students increased with online learning pressures [23]. Earlier studies found that about 34.6% of students experienced psychosocial and behavioral problems. Long screen time and family conflict were among the main contributing factors [24]. These findings help explain the rising trends observed among adolescents. However, this study does not allow conclusions about cause-and-effect relationships.
Women showed a more pronounced increase in DALYs lost due to depression compared with men. This disparity may be shaped by a combination of biological and psychosocial factors, as well as gender roles that amplify vulnerability to internalizing disorders. Biologically, fluctuations in reproductive hormones such as estrogen and progesterone play a crucial role in mood regulation and stress response, particularly during sensitive phases such as puberty, menstruation, pregnancy, and menopause, as documented in previous studies [25]. Psychosocially, women are more likely to adopt emotion-focused coping strategies, which have been associated with a higher risk of mood disorders compared to men, who more often rely on problem-focused coping [26].
Beyond biological and psychosocial factors, women also experience gender-related pressures in their social lives. These include social expectations, the double burden of family and professional roles, and exposure to gender-based violence, all of which cumulatively elevate their psychological burden [27]. Evidence from the Global Burden of Disease (GBD) data further reinforces this pattern, showing that women consistently experience a greater share of DALYs lost due to depression across most age groups and regions, including Indonesia [27]. These observations suggest the need for gender-sensitive mental health strategies, rather than implying direct causal mechanisms.
The burden of depressive disorders tends to be higher in the western and some central regions of Indonesia, particularly in provinces such as Aceh, West Sumatra, DKI Jakarta, North Kalimantan, and North Sulawesi. Meanwhile, most provinces in the eastern part of Indonesia show a comparatively lower burden, although variations still exist. This pattern remained relatively consistent between 2019 and 2021, with a slight increase in intensity in several central and eastern provinces, indicating a rising burden of depression during the COVID-19 pandemic period.
This phenomenon highlights that depression is not merely an individual health issue but is also deeply influenced by social and geographical contexts. Regions with rapid urbanization and high economic activity, such as DKI Jakarta, are more vulnerable to work-related stress, life pressures, and social isolation that trigger depressive symptoms. Rapid urbanization without adequate planning can intensify the burden of mental disorders due to psychosocial stressors in urban settings [28].
Eastern Indonesia, where mental health services are limited, may have underreported cases, which could make DALYs lost seem lower than they actually are. Previous studies suggest that stigma, financial constraints, and service gaps are major barriers to accessing mental health care in remote areas of Indonesia [29]. These disparities should be interpreted cautiously and highlight the need for improved mental health surveillance and service coverage.
Spatial analysis indicates that depression patterns shifted after the COVID-19 pandemic. The burden appears to have increased in several provinces, including West Sulawesi, Central Sulawesi, and West Nusa Tenggara. This trend may be associated with economic pressures, social isolation, and limited access to health services during the pandemic. Other studies have shown that the global prevalence of depression during the pandemic reached 32%, with fear of infection and exposure to cases being the main risk factors, especially in countries with low preparedness for mental health care [30].
These limitations have important implications for the interpretation of the findings. Given the ecological study design and the use of secondary, population-level estimates from the Global Burden of Disease (GBD) study, the observed temporal and spatial patterns should not be interpreted as evidence of causal relationships at the individual level. Differences observed across provinces may reflect a combination of true variation in disease burden, differences in data availability, model-based estimation procedures, and underlying assumptions of the GBD framework. Consequently, regional comparisons should be interpreted cautiously, particularly in areas with limited health surveillance and mental health service coverage. The findings are therefore best understood as indicators of population-level trends and spatial heterogeneity, which can inform hypothesis generation and public health planning rather than causal inference.
5. STUDY LIMITATIONS
This study relied on secondary GBD 2021 data, which may include modeling uncertainties and variations in data quality across provinces. The ecological design limits causal interpretation, as analyses were conducted at the population rather than the individual level. Provincial differences in mental health service coverage may also affect the accuracy of DALY estimates. Future research should use primary data and incorporate more detailed sociodemographic and environmental predictors.
CONCLUSION
The burden of depressive disorders in Indonesia has increased significantly from 1990 to 2021, with a sharp spike during 2019–2021 that was associated with the COVID-19 pandemic. The increase is most pronounced among adolescents (<20 years) and women, reflecting biological and psychosocial vulnerabilities as well as social and digital influences. Higher burdens are observed in western and some central provinces, while eastern regions report lower levels, likely due to limited mental health services and underreporting. These findings highlight the need for targeted mental health interventions by age, sex, and geographic location, focusing on adolescents, women, and high-burden regions.
AUTHORS’ CONTRIBUTIONS
The authors confirm their contributions to the paper as follows: X.L.: Responsible for the study conception and design, while J.L., Y.Z., and X.D.: Prepared the draft manuscript. All authors reviewed the results and approved the final version of the manuscript.
LIST OF ABBREVIATIONS
| AAPC | = Average Annual Percent Change |
| APC | = Annual Percent Change |
| DALYs | = Disability-Adjusted Life Years |
| GBD | = Global Burden of Disease |
| GHDx | = Global Health Data Exchange |
| IHME | = Institute for Health Metrics and Evaluation |
ETHICS APPROVAL AND CONSENT TO PARTICIPATE
This study obtained ethical clearance from the Ethics Committee of the Faculty of Public Health, Universitas Airlangga, Indonesia with approval number: 251/EA/KEPK/2024, dated December 10, 2024.
HUMAN AND ANIMAL RIGHTS
All procedures performed in studies involving human participants were in accordance with the ethical standards of institutional and/or research committee and with the 1975 Declaration of Helsinki, as revised in 2013.
CONSENT FOR PUBLICATION
This study used publicly available, de-identified secondary data from the Global Burden of Disease (GBD) Study, and no individual-level or identifiable information was involved.
AVAILABILITY OF DATA AND MATERIALS
The data that support the findings of this study are publicly available from the Institute for Health Metrics and Evaluation (IHME) at http://ghdx.healthdata.org/.
FUNDING
The research was supported by a grant from Beasiswa Pendidikan Indonesia (BPI)/LPDP (the Indonesian Endowment Fund for Education, Ministry of Finance of the Republic of Indonesia), Grant Number 01368/J5.2.3./BPI.06/9/2022.
ACKNOWLEDGEMENTS
The authors are very grateful to the Institute for Health Metrics and Evaluation (IHME) for providing the 2021 Global Burden of Disease data free of charge for scientific publication purposes. The authors want to express their gratitude to the Doctoral Program in Public Health, Faculty of Public Health, Universitas Airlangga, for granting permission and the opportunity to conduct this study.

