All published articles of this journal are available on ScienceDirect.

Levels of Physical Activity among Kuwaiti Adults and Perceived Barriers
Authors Info & Affiliations
Abstract
Background:
Regular Physical activity is associated with many positive health outcomes related to prevention and control of obesity and non-communicable diseases which have a high prevalence in Kuwait. The aim of our study was to investigate the level of physical activity among Kuwaiti adults and interfering barriers.
Methods:
A cross sectional randomized study was used to collect data about physical activity level among 858 Kuwaiti adults using the International Physical Activity Questionnaire, Arabic version and perceived barriers to physical activity were investigated using an ecological framework. Regression analysis was used to determine the predictors of physical activity among participants.
Results:
The results revealed that 19.13% of the sample did not perform any physical activity and 38.1% had low physical activity level, with no significant difference between males and females. The most common perceived barriers were hot weather (75.9%), work duties (71.21%), laziness (44.3%), lack of time (38.6%), family responsibilities (36.1%) and chronic diseases (33.33%).
Conclusion:
The level of physical activity among Kuwaiti adults was found to be low. This could be a reason for high levels of obesity in Kuwait. A comprehensive health promotion program including environmental and social modifications in addition to health education is suggested to improve physical activity among Kuwaiti adults.
INTRODUCTION
Physical activity (PA) is defined as any bodily movement produced by skeletal muscles that require energy expenditure [1]. Recent reviews have concluded that regular PA is associated with many positive health outcomes related to prevention and control of non-communicable diseases (NCDs) as cardiovascular diseases, diabetes, cancer, osteoporosis and premature death [2]. It is also associated with positive psychological consequences as reducing the risk of depression [3].
According to a study done on world obesity prevalence by the World obesity federation in November, 2014, Kuwait was ranked first among adult males in the Eastern Mediterranean region with an obesity prevalence of 36.4% and ranked second for adult females in the Eastern Mediterranean region with an obesity prevalence of 47.9% [4].
The rapid increase in wealth and subsequent development of Gulf countries has lead to dramatic changes in lifestyle. Fast food chains, easy access to cars and increased popularity of processed foods, lack of exercise, etc have caused an increase in obesity in Gulf countries [5].
A World Health Organization report indicated that gulf countries had the highest rate of obesity with Kuwait, Bahrain, Saudi Arabia and United Arab Emirates in the list of top ten countries worldwide in terms of obesity. Kuwait is the worst affected with 42.8% of the population obese which places Kuwait in the top of the 10 most obese countries in the world [6].
Kuwait ranked ninth globally in prevalence of diabetes with a rate of 23.13% [7] while cardiovascular diseases constitute 41% and cancer 14% of all death causes [8]. Despite these alarming figures, previous studies revealed a low level of physical activity among school students, college students and chronic patients in Kuwait [9-11].
The high level of obesity and chronic diseases in Kuwait amongst its population along with low levels of physical activity has put a considerable load on the healthcare system in Kuwait. The public health system in Kuwait is built on the primary health care principles with three levels of health care delivery: primary, secondary and tertiary. Primary health care infrastructure is well developed with proper integration of non-communicable diseases and mental health within the system. Currently, there are 92 primary health care centers in the country providing services to people in 5 health regions [12].
A number of theoretical models have been used as a basis for understanding physical activity behavior. Regarding the multi-factorial nature of physical activity, ecological model was selected in this study to investigate the personal, social and environmental factors that affect physical activity levels [13]. Barriers to physical activity were investigated in other Gulf countries however health behaviors and influencing barriers depend on cultural, economic and political environments which are different in each country [14].
The objectives of the study were to determine the levels of physical activity among Kuwaiti adults and investigate the perceived interfering barriers. We also ask the following research questions: 1. Level of physical activity among Kuwaiti adults. 2. Is there a major difference between genders in levels of physical activity? 3. What are the barriers in Kuwait to performing physical activity?
MATERIALS AND METHODOLOGY
Study Design and Study Setting
A cross sectional study was conducted among Kuwaiti adults from both sexes, who attended the primary health care centers in Kuwait during the period from April, 2014 to August, 2014.
Kuwait is divided into six governorates: Capital, Farwaniya, Hawali, Jahra, Ahmadi and Mubarak Alkabeer. Of the six governorates, the first five have an administrative health region where inhabitants are registered. Mubarak Alkaber though established in the year 2000, its inhabitants are still registered in Ahmadi, Farwaniya and Hawali health regions. Hence we have used these five districts according to health regions for data collection.
Two Primary healthcare centers were randomly selected from each of the five health districts of Kuwait. (The primary health care centers were chosen to conduct the study because they represent the first step for all Kuwaitis for treatment of minor illnesses, checkups and follow up of chronic and acute illnesses.)
Participants
A simple random sampling was used to select the participants through a random number generator. Inclusion criteria were: Kuwaiti, adults (21 to less than 65years old) and from both sexes. Exclusion criteria were: pregnant females, emergency cases (minor cut wounds, minor accidents etc which can be treated in a primary healthcare setting), persons who have mobility impairment and those with an illness that hinders their normal daily activity within the last 7 days.
Ideally we would have liked to have a sample starting at 18 years old and going on above 65. However in the setting in which we are best able to collect data there are certain limitations. Since persons aged up to 20 need parental consent to participate in the study, we chose to interview persons aged 21 or above. In the case of older adults, most of them suffer from chronic ailments and hence would be visiting specialty clinics for their conditions. Hence we restricted our sample to adults aged 21-65 years old.
The sample size was calculated according to the last census in Kuwait conducted in 2011 and estimating the number of Kuwaiti adults’ citizens to be around 530.000 persons [15] and considering a confidence level of 95% and a confidence interval of 5%, it was found that the sample must not be less than 384. The target sample was planned to be 1000 Kuwaiti adults (200 from each health district).
From those who met the study criteria, 1500 Kuwaiti adults were asked to complete the questionnaire out of which 1061 adults were willing to participate with a response rate of 70.73%. The final sample size was 858 participants as 203 adults (19.13% of the sample) did not perform any physical activity and were excluded from statistical analysis according to the IPAQ scoring protocol [16]. We chose to oversample in order to increase the power of our findings since a larger sample gives more significance.
From our final sample, 50.4% of the sample was males, 72. 14% were between 21 and 40 years old, about one third had diploma degree and 28.5% had a university degree. Nearly two thirds of participants were married (60.48%) and 31.15% were singles. Those who earned less than 5000$/month constituted 63.4% of the sample.
Instrument
An interview questionnaire was constructed to collect data about Physical activity level and interfering barriers. The questionnaire consisted of four parts. First part collects data about socio-demographic characteristics and presence of Chronic disease. Socio-demographic data included Sex, Age, Educational level, Social status, Monthly income and Number of children.
Second part assessed the level of physical activity among participants using the official International Physical Activity Questionnaire (IPAQ) short form Arabic version [17]. This instrument has been validated and used by several studies among adults in Gulf countries [11, 18]. IPAQ consists of 7 questions that estimate physical activity level based on frequency and duration of moderate and vigorous intensity activities, walking and sitting/lying down during the last seven days . The questions include physical activity at home, work, transportation and during leisure time. Metabolic equivalents of physical activity (MET) was calculated and then level of physical activity was classified according to IPAQ scoring protocols: High physical activity level was estimated on the basis of 7 or more days of any combination of walking, moderate-intensity or vigorous intensity activities achieving a minimum of at least 3000 MET-minutes/week, moderate physical activity level on the basis of 5 or more days of any combination of walking, moderate-intensity or vigorous intensity activities achieving a minimum of at least 600 MET-min/week. Participants were classified as having low level of physical activity if they performed some physical activity but not enough to meet high or moderate levels [17].
Third part investigated barriers to physical activity. After review of literature [13, 14, 19, 20], 19 barriers were selected and categorized into Personal barriers (12 items), Social barriers (4 items) and Environmental barriers (3 items). Participants could choose more than one item in every category and the percent of each barrier was calculated according to the number of participants who selected it. This part of the questionnaire was tested for face and content validity. Reliability was assessed using test-retest method and it yields a Cronbach’s alpha value of 0.809 for the 19 items.
Fourth part of the questionnaire was designated to measure Height and Weight. The standing height of the participants was measured without shoes using a portable stadiometer in centimeters and recorded to the nearest 0.1cm. The weight of the participants was measured without shoes using a standardized balanced scale in kilograms and recorded to the nearest 0.1kg. The body mass index (BMI) was calculated using the formula: BMI (kg/m2) = body weight (kg)/ (body height*body height) (m2). BMI was categorized according to WHO classification [4].
Health educators and doctors from Health Promotion Department, Ministry of Health were trained on completing the interview questionnaire and taking the measurements for height and weight. A pilot study was conducted in two primary health care centers, one from the Capital district and the other in Hawali district, for 69 Kuwaiti adults. The participants in the pilot study demonstrated a good understanding and response to the questionnaire. Therefore the same questionnaire was used in the final study.
Statistical Analysis
Data analyses were undertaken using Statistical Package for the Social Science 20. The data was checked first for outliers according to guidelines from IPAQ; cases having a Total MET of 0 were excluded from further analysis. Summary statistics as numbers and percentage, mean and standard deviation were used to describe data. Chi square test was used to assess the association between categorical variables, independent t-test and Mann-Whitney U test for quantitative data. Barriers to physical activity were calculated by summing the score of each item in the category and the total score of barriers calculated by summing the total score of all three categories. Independent t-test and one-way ANOVA was then used to calculate the mean of individual barriers and of the total barriers. Multiple logistic analyses were used to identify the significant barriers to physical activity after adjusting for confounding between the variables. Physical activity levels – the dependent variable were transformed into dichotomous variables where moderate and high levels of physical activity were grouped as satisfactory physical activity (0) while low level was renamed as unsatisfactory physical activity (1) .The included independent variables were socio-demographic factors, BMI and all the barriers to physical activity. The adjusted Odds ratio and the 95% confidence interval were reported. A p-value of 0.05 or less was considered as the cut-off level for statistical significance.
Ethical Considerations
Permission to conduct the study was obtained from the Standing Committee for Coordination of Health and Medical research, Ministry of Health, Kuwait. A written consent was taken from each participant before administering the questionnaire.
RESULTS
Table 1 shows that nearly one third of the sample (35.9%) was overweight, 26.1% were obese and 2.5% had morbid obesity. Around one third of the participants suffered from a chronic disease (35.9%).
| Variable | Males (50.4%) | Females (49.6%) | Total (858) | P- value | ||||||
|---|---|---|---|---|---|---|---|---|---|---|
| N | % | N | % | N (%) | ||||||
|
BMI Categories Underweight Normal Overweight Obese Morbid Obesity |
6 137 161 77 8 |
54.5% 52.3% 58.3% 38.3% 42.1% |
5 125 115 124 11 |
45.5% 47.7% 41.7% 61.7% 57.9% |
11(1.4%) 262(34.1%) 276(35.9%) 201(26.1%) 19(2.5%) |
0.001** |
||||
|
Chronic Disease No chronic disease Chronic disease |
287 133 |
66.6% 46.5% |
263 153 |
61.9% 53.5% |
550(64.1%) 286(35.9%) |
0.272 |
||||
The table shows a significant relation between gender and BMI (χ2= 19.668, P≤0.001), 61.7% of females and 38.3% of males were obese.
Table 2 shows that males had a significant higher level than females regarding Days of vigorous physical activity (Z=7.28, p≤0.000), Minutes of vigorous activity/day (Z=6.86, p≤0.000), Number of walking days /week (Z=3.20, p≤.001) and Minutes of walking/day (Z=2.30, p=0.021). On the other hand, females had a higher level concerning: Days of moderate activity/week (Z=7.58, p≤0.000), Minutes of moderate physical activity/day (Z=7.41, p≤0.000) and Duration of sitting/day (Z=1.96, p=0.05).
| Mean ± S.D | Mann Whitney | ||
|---|---|---|---|
| Male | Female | p-value | |
| Total Met | 3060.58±3416.007 | 2694±3667.311 | 0.07 |
| Vigorous activity days/week | 2.43±2.62 | 1.16±1.932 | 0.000** |
| Vigorous activity minutes/ day | 51.49±59.71 | 27.49±55.94 | 0.000** |
| Moderate activity days/week | 1.55±2.31 | 2.83±2.74 | 0.000** |
| Moderate activity minutes/day | 28.71±50.99 | 61.14±87.95 | 0.000** |
| Walking days/week | 4.50±2.52 | 3.90±2.68 | 0.001** |
| Walking minutes/day | 50.68±51.50 | 47.74±57.69 | 0.021** |
| Sitting minutes/day | 167.55±171.29 | 195.69±195.42 | 0.05** |
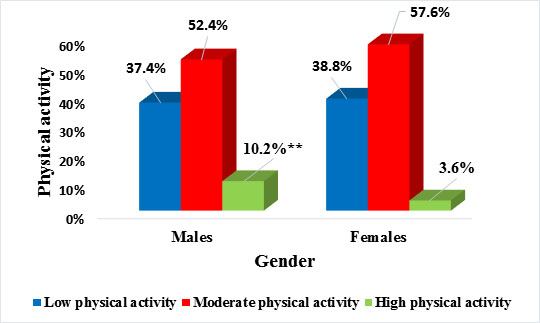
Fig. (1) below shows Categories of physical activity in relation to gender as the following: 37.4% of the males and 38.8% of females had low level of physical activity. 52.4% of males and 57.6% of females had moderate level of activity. Only 10.2% of males and 3.6% of females had high activity level. These results revealed that 38.1% of the sample had low physical activity level. There was a significant relation between gender and physical activity categories (χ2= 15.028, P≤0.001).
In Table 3 the highest percent of personal barriers was concerning: Work duties (71.21%) followed by Laziness (44.3%), Lack of time (38.6%) then Fatigue/Tiredness (21.1%). The main social barriers were: Family responsibilities (36.1%) of the responses followed by Lack of support of friends/relatives (11.6%). Bad weather was the highest environmental barrier (75.9%) followed by Unavailability of nearby facilities (11.2%).
| Barriers | Males | Females | Total a | P- Value | ||
|---|---|---|---|---|---|---|
| Personal Barriers | N | % | N | % | N (%) | |
| Chronic disease | 133 | 46.5% | 153 | 53.5% | 286 (33.33%) | 0.272 |
| Disease limiting movement | 39 | 49.4% | 40 | 50.6% | 79(9.20%) | 0.854 |
| Exercise is boring | 32 | 40.5% | 47 | 59.5% | 79(9.20%) | 0.066 |
| Laziness | 172 | 45.5% | 206 | 54.5% | 378(44.3%) | 0.009** b |
| Cost of joining the gym | 36 | 51.4% | 34 | 48.6% | 70(8.2%) | 0.851 |
| Traditional clothes | 22 | 53.7% | 19 | 46.3% | 41(4.8%) | 0.664 |
| Physical activity would ruin my appearance | 7 | 53.8% | 6 | 46.2% | 13(1.5%) | 0.779 |
| Work duties | 309 | 50.6% | 302 | 49.4% | 611(71.21%) | 0.595 |
| Lack of time | 126 | 38.2% | 204 | 61.8% | 330(38.6%) | 0.000** b |
| Fatigue, tiredness | 68 | 37.6% | 113 | 62.4% | 181(21.1%) | 0.000** b |
| Excessive internet, TV | 83 | 47.4% | 92 | 52.6% | 175(20.4%) | 0.386 |
| No past habit of physical activity | 24 | 40.0% | 36 | 60.0% | 60(7%) | 0.096 |
| Mean number of personal barriers | 1.84±1.54 | 2.32±1.67 | 2.08±1.62 | 0.292c | ||
| Social factors | ||||||
| Family responsibilities | 120 | 38.8% | 189 | 61.2% | 309(36.1%) | 0.000** b |
| Lack of family support | 31 | 38.8% | 49 | 61.2% | 80(9.3%) | 0.029** b |
| Lack of support from friends/relatives | 51 | 51.5% | 48 | 48.5% | 99(11.6%) | 0.796 |
| Social norms | 20 | 44.4% | 25 | 55.6% | 45(5.3%) | 0.416 |
| Mean number of social barriers | 0.52±0.718 | 0.73±0.745 | 0.62±0.739 | 0.862 c | ||
| Environmental factors | ||||||
| Bad weather | 319 | 49.1% | 331 | 50.9% | 650(75.9%) | 0.186 |
| Unavailability of nearby facilities | 36 | 37.5% | 60 | 62.5% | 96(11.2%) | 0.008** b |
| Lack of safe places | 47 | 53.4% | 41 | 46.6% | 88(10.3%) | 0.545 |
| Mean number of environmental barriers | 0.93±0.663 | 1.02±0.653 | 0.97±0.659 | 0.145 c | ||
| Mean of total number of barriers | 3.29±2.32 | 4.08±2.30 | 3.68±2.347 | 0.262 c | ||
Among personal barriers, females had a significant higher percent than males in relation to lack of time (χ2= 31.810, p≤0.000), fatigue/tiredness (χ2= 15.00, p≤0.000) and laziness (χ2= 6.857, p=0.009).
Concerning social barriers to physical activity, the main difference between males and females was related to family responsibilities and Lack of support from families where females had a higher percent for these two barriers (χ2= 25.650, p≤0.000 and χ2= 4.750, p=0.029 respectively).
As regards to environmental barriers, a significant higher percent of females mentioned unavailability of nearby facilities as a barrier to physical activity (χ2= 7.143, p=0.008). There was no significant difference between males and females regarding the Mean of total number of barriers.
Table 4 demonstrates that there was a significant relation between physical activity level and social status; single participants had the higher percent of high physical activity (9.6%) while widowed participants had the higher percent of low physical activity (45.0%) (χ2= 20.38, p=0.002).
| Variable | Low | Moderate | High | χP-value | |||
|---|---|---|---|---|---|---|---|
| N | % | N | % | N | % | ||
|
Age Category Young (21-40) Middle Age (41-60) Elderly (60 & above) |
221 89 14 |
35.6% 44.5% 42.4% |
351 101 19 |
56.5% 50.5% 57.6% |
49 10 0 |
7.9% 5% 0% |
0.072 |
|
Educational Level Less than high school High school Diploma University Post-graduate |
25 70 113 93 21 |
43.9% 36.1% 38.8% 38.0% 35.0% |
30 107 164 131 34 |
52.6% 55.2% 56.4% 53.5% 56.7% |
2 17 14 21 5 |
3.5% 8.8% 4.8% 8.6% 8.3% |
0.639 |
|
Social Status Single Married Divorced Widowed |
77 224 17 9 |
28.4% 43.0% 38.6% 45.0% |
168 265 26 11 |
62.0% 50.9% 59.1% 55.0% |
26 32 1 0 |
9.6% 6.1% 2.3% 0% |
.002** |
|
Monthly Income Less than 5000$ 5000-1000$ More than 10000$ |
197 80 19 |
36.1% 38.5% 48.7% |
311 115 16 |
57.1% 55.3% 41.0% |
37 13 4 |
6.8% 6.2% 10.3% |
0.393 |
|
No. of children No children 1-2 children 3-4 children 5 or more children |
108 69 74 72 |
31.0% 42.9% 43.2% 41.6% |
205 81 88 96 |
58.9% 50.3% 52.1% 55.5% |
35 11 8 5 |
10.1% 6.8% 4.7% 2.9% |
0.004** |
|
BMI Categories Underweight Normal Overweight/obese/ morbid Obesity |
4 85 200 |
36.4% 32.3% 40.3% |
5 151 271 |
45.5% 57.4% 54.6% |
2 27 25 |
18.2% 10.3% 5.0% |
0.017** |
Physical activity was also significantly related to number of children, those who had no children were the highest group to perform high physical activity (10.1%) while those who had 3-4 children were the highest category to perform low physical activity (43.2%) (χ2= 19.290, p≤0.004).
BMI categories had also a significant relation to physical activity; overweight /obese persons had the lowest percent of high physical activity (5.0%) and had the highest level of low physical activity (40.3%). (χ2= 12.005, p=0.017).
Table 5 demonstrates that there was a significant relation between the mean number of social barriers and educational level; post-graduates had the highest mean number of 0.80±0.84 and less than high school had the lowest mean of 0.49±0.68 (F=2.39, p= 0.049) and there was a significant relation between the social status and both social barriers and total barriers;(F=11.77, p≤0.000 and 2.64, p=0.048 respectively). Married group had the highest mean number of both social barriers and total barriers while singles had the lowest mean. There was also a significant relation between number of children and personal, social and total barriers (F= 3.12, p= 0.025, 19.40, p≤0.000 and 5.79, p≤0.001 respectively). Participants who had 1-2 children had the highest mean of personal, social barriers and total barriers and those with no children had the lowest means.
| Variable | Personal barriers | Social barriers | Environmental barriers | Total barriers |
|---|---|---|---|---|
|
Gender Males Females |
1.84±1.54 2.32±1.67 |
0.52±0.71 0.73±0.74 |
0.93±0.66 1.02±0.65 |
3.29±2.32 4.08±2.30 |
| P- valuea | 0.292 | 0.862 | 0.142 | 0.262 |
|
Age Category Young (21-40) Middle age (41-60) Elderly (60 &above) |
2.14±1.65 1.96±1.45 1.52±1.82 |
0.62±0.73 0.67±0.75 0.42±0.614 |
0.97±0.65 1.02±0.665 0.85±0.71 |
3.73±2.37 3.66±2.13 2.79±2.55 |
| P- valueb | 0.054 | 0.200 | 0.325 | 0.079 |
|
Educational level Less than high school High school Diploma University Post- graduate |
1.74±1.47 2.09±1.77 2.13±1.62 2.04±1.47 2.22±1.81 |
0.49±0.68 0.55±0.69 0.67±0.74 0.58±0.70 0.80±0.84 |
0.98±0.69 0.91±0.64 0.97±0.63 1.03±0.72 0.98±0.53 |
3.21±2.19 3.55±2.38 3.77±2.38 3.66±2.16 4.00±2.79 |
| P- valueb | 0.501 | 0.049** | 0.497 | 0.362 |
|
Social status Single Married Divorced widowed |
2.03±1.53 2.09±1.69 2.28±1.46 1.80±1.28 |
0.41±0.69 0.73±0.75 0.61±0.57 0.65±0.48 |
0.93±0.65 1.02±0.66 0.84±0.60 0.85±0.48 |
3.37±2.26 3.85±2.41 3.77±2.18 3.30±1.55 |
| P- valueb | 0.683 | 0.000** | 0.086 | 0.048** |
|
Monthly income Less than 5000$ 5000-10000$ More than 10000$ |
2.07±1.63 2.20±1.53 1.97±1.70 |
0.62±0.73 0.65±0.72 0.62±0.90 |
0.97±0.63 0.96±0.62 0.97±0.87 |
3.66±2.34 3.83±2.21 3.56±2.68 |
| P- valueb | 0.513 | 0.871 | 0.983 | 0.640 |
|
Number of children No children 1-2 child 3-4 child 5 children and more |
2.07±1.64 2.37±1.74 1.83±1.48 2.09±1.57 |
0.42±0.67 0.90±0.83 0.74±0.73 0.67±0.65 |
0.91±0.66 1.04±0.67 1.02±0.60 1.01±0.68 |
3.40±2.33 4.31±2.59 3.60±2.16 3.77±2.16 |
| P- valueb | 0.025** | 0.000** | 0.091 | 0.001** |
|
BMI category Underweight Normal Overweight/ obese/ morbid obese |
2.55±2.16 2.09±1.69 2.06±1.60 |
0.91±0.53 0.57±0.74 0.63±0.72 |
1.18±0.75 1.00±0.65 0.96±0.67 |
4.64±2.58 3.68±2.45 3.66±2.31 |
| P- valueb | 0.621 | 0.235 | 0.467 | 0.399 |
Table 6 from the 19 barriers entered in the regression analysis, four barriers were found positively associated with increased level of unsatisfactory physical activity namely: presence of chronic disease adjusted OR 1.813 (95%CI 1.059-3.107), laziness adjusted OR 1.729 (1.190-2.511), lack of support from friends/ relatives adjusted OR 2.120 (1.219-3.689) and lack of safe places adjusted OR 1.872 (1.002-3.495).
|
Crude analysis OR (IC95%) |
P-value |
Adjusted analysis* OR (IC95%) |
P-value | |
|---|---|---|---|---|
| Chronic diseases | 2.070(1.387-3.089) | 0.000 | 1.813(1.059-3.107) | 0.030** |
| Laziness | 1.488 (1.127-1.966) | 0.005 | 1.729(1.190-2.511) | 0.004** |
| Lack of Support from friends/relatives | 1.772 (1.163-2.699) | 0.008 | 2.120 (1.219-3.689) | 0.008** |
| Lack of safe places | 1.858(1.195-2.887) | 0.006 | 1.872(1.002-3.495) | 0.049 |
DISCUSSION
WHO ranked physical inactivity as the fourth risk factor for mortality worldwide and a major contributor to occurrence of NCDs [1]. The first step in planning an integrative national health promotion program for physical activity in Kuwait is to understand its determinants. Engagement in physical activity is determined by several personal, social and environmental factors and the ecological model provides an appropriate framework to address all these factors [13].
In concordance with other studies reporting low levels of physical activity in Kuwait, the present study found that around 19.13% of the sample did not perform any physical activity. Of the selected sample, 38.1% had a low level of physical activity, 55% had moderate level of physical activity and 6.9% of the sample had high level of physical activity.
This result is similar to the results of WHO survey conducted in 2013 which estimated the level of physical inactivity among adults is around 63% [21]. Low level of physical activity appears to be a worldwide problem as reported by previous studies [22-25]. Lack of physical activity is a common problem in the Gulf region; it was estimated that the level of satisfactory physical activity was as low as 39.0% in men and 26.3% in women [26].
Although females had lower total physical activity than males (Total MET of 2694±3667.3 in females versus 3060.58±3416.007 in males), the difference between the two genders was not significant. This finding is contradictory to the results of the survey conducted by WHO that reported a significant difference in physical activity between both sexes. The WHO survey used a different tool to assess physical activity during leisure time and work but not at home [21]. In the present study females reported higher moderate activity level due to housekeeping activities which compensated for the higher level of vigorous activity and walking reported by males. The higher physical activity performed by females in house duties was also reported in both developed and developing countries [18, 22, 27].
Similar to the results of previous research [18, 28], females had a significant higher level of sedentary behavior which may explain the higher percent of obesity among females (61.7% of obese persons were females) in spite of the insignificant difference in total physical activity between the two sexes. Most of the families in Kuwait and Saudi-Arabia employ cooks and house maids which could be a reason for higher sedentary behavior among females [6]. In another study in Qatar, female participants suggested that there should be less dependency on house maids which would facilitate more physical activity at home [5]. On the other hand, gender was not related to number of barriers which is contradictory to several studies describing a significant higher number of barriers among women [23].
Regarding personal barriers, work (71.21%), laziness (44.3%), lack of time (38.6%) and presence of chronic disease (33.3%) were the most common cited barriers. These barriers were also stated as the most common barriers to physical activity in many other countries [2, 29].
Females in our study had a higher percent of laziness, lack of time and fatigue which can be justified by their higher family responsibilities in comparison to men [20, 29].
Regression analysis revealed that Laziness and chronic diseases were predictors of physical activity level. The negative effect of chronic diseases on physical activity is documented by previous research [26, 30] which concluded that presence of diseases and perception of poor health decreases the frequency and intensity of physical activity.
Despite the high prevalence of commitment to work and lack of time among the sample as barriers, they were not predictors of physical activity level. However, many studies demonstrated a significant relation between these two factors and physical activity [23, 29]. Similarly, family responsibilities were the highest social barrier (36.1%), which conforms with the age distribution of our sample (three quarters belonged to the age group 21-40) [20, 29].
Females had a significant higher perception of family responsibilities and lack of family support as barriers. However, regression analysis revealed that support from friends and relatives not from family was one of the predictors of physical activity level among our sample. Social support appears to have a significant effect on engagement in physical activity across all age groups, cultures and countries. Social support may increase motivation and self-efficacy through verbal encouragement and role modeling. It also plays a role as a resource by giving information or helping with children [20, 23]. The relation between environmental conditions and physical activity appears to differ according to the settings of the studies. Many researches detected no relation between them [31] while other studies identified unsuitable weather, inaccessibility to physical activity facilities and lack of safety as significant factors hindering physical activity [23, 30].
The present results showed that weather was the most prevalent barrier to physical activity (75.9%). This finding was expected as hot weather was reported as a main barrier to physical activity in other countries in the Gulf region [11, 14]. More females than males perceived unavailability of nearby facilities as a barrier ; easy access to recreational facilities encourage women with many family responsibilities and limited time to perform physical activity. Regression analysis revealed that lack of safety was significantly related to physical activity level. Unavailability of safe recreational places was considered a prime obstacle to physical activity in USA and Europe [23, 30].
It is to be noted that although social norms and traditional clothes were reported as obstacles to physical activity in other gulf countries especially among women [32], a small percent of our sample perceived these factors as barriers and they were not significantly related to physical activity level which reflects the more permissible social norms for women in Kuwait.
Regarding the relation between socio-demographic factors and both physical activity level and number of barriers, the study found that married persons and those with more children had significant higher number of social barriers and lower physical activity level. The effect of marriage on physical activity was controversial between studies. Some studies revealed that married persons had a higher level of physical activity due to increased social support [23, 25].
On the other hand, other researchers concluded that marriage was related to higher number of barriers and lower physical activity level specially among women due to increased family responsibilities and lack of time [22, 29]. Presence of children was stated by previous studies as a barrier to physical activity [29].
In contradiction to other studies, which used similar age group of participants, IPAQ was used to measure physical activity and similar questions on barriers to physical activity [18, 22, 25, 30], physical activity and number of barriers were not related to age. The lowest level of physical activity among the present sample was reported in the middle age group between 41 and 60 years. The curvilinear relationship between physical activity and age was reported in a study conducted in Saudi Arabia [33]. In that study the most inactive group was from 30-49 years old. Decline in family responsibilities and retirement may contribute to increased physical activity among those above 60 years old.
Despite the wide array of research relating educational level to physical activity and number of barriers, the present sample did not find a significant relation between them. Persons with higher education are supposed to have better information resources, lower perception of barriers and higher engagement in healthy behavior [22, 25].
In addition, physical activity and number of barriers were not significantly related to social level and income. In view of the relative high income of Kuwaiti citizens, the difference in social level and income was not so great to affect physical activity as it is the case in developing countries [28].
Obesity was not significantly related to number of perceived barriers in our sample however there was an inversely significant relation between obesity and physical activity level (5.0% of overweight/ obese group had high physical activity level opposite to 10.3% of those with normal weight). Previous research estimated that the relation between low physical activity and obesity may be bidirectional ; obesity was considered a cognitive barrier to physical activity due to shyness, embarrassment, decreased self-efficacy and higher and perception of barriers [22, 25, 30, 33].
CONCLUSION
The present study revealed that adult Kuwaitis have a low level of physical activity with no significant difference between genders. Perceived barriers to physical activity varied between personal, social and environmental factors which necessitate a comprehensive promotion program to increase the level of physical activity among Kuwaiti adults. Health education is a corner stone to change lifestyle behavior but environmental changes as provision of safe parks and fitness centers near residential areas, can have a positive impact on physical activity level especially among females.
CONFLICT OF INTEREST
There is no potential conflict of interest with any party. This research was self-funded by the Health Promotion Department, Ministry of Health, Kuwait.
ACKNOWLEDGEMENTS
The successful completion of this research would not have been possible without the support of numerous Government agencies and individuals.
Our great thanks are to those who were supportive in the whole process. The research would not have been possible without the kind permission and assistance from the Assistant Under-Secretary of Health Affairs -Ministry of Health, Kuwait, Dr. Mohammed AL-Kashti.
Special thanks go to the Directors of the five Health Districts, Heads and staff of all the primary health care clinics that participated in the research data collection and all the Kuwaiti nationals that agreed to take part in this research.
We also acknowledge the contribution of the various Research Health educators who participated in data collection.

