All published articles of this journal are available on ScienceDirect.

A Markov Chain Approach to the Pattern of Blood Donation Status at a Blood Service Centre in Zimbabwe
Abstract
Background:
Blood donors’ behaviour towards blood donation is not easily predictable and can be considered a stochastic random variable. A four-state Markov chain technique was defined and adopted in this study. The transition probabilities of blood donation within the four identified states, viz: new, regular, occasional, and lapsed donors were used to making further inferences about the dynamics in blood donation in Harare, Zimbabwe.
Objectives:
The paper presents a four-state Discrete Time Markov Chain (DTMC) model in analysing the changes in blood donation status over the four-year study period.
Methodology:
A transition probabilities matrix was developed and parameters estimated using the maximum likelihood method and two other approaches, and inferences were made based on the resultant transition matrix.
Results:
About 56% of new donors made at least one repeat donation and became regular donors within the first year, and the numbers gradually declined with time, whilst the lapsed donors increased from 35.6% in the second year to 55.6% in year 4. The long-run probabilities tell the same, with 80.9% of blood donations becoming lapsed in the long run. Depending on the current state of donation, new or regular donations will likely move to the regular donation state in the following time step (year). On the other end, occasional and lapsed donations have a higher probability of entering the lapsed donation state in the following time step (year).
Conclusion:
The paper provides useful insights into the Markovian transition probabilities among the blood donation states, and this has implications on future blood donors’ pool and blood bank inventory in Zimbabwe. The decline in the number of donors who make repeat donations is a worrisome trend since regular donations are the lifeline of any blood service centre.
1. INTRODUCTION
The invaluable contribution made by blood donors in saving lives has made the study of blood donors’ knowledge and attitudes towards blood donation a major concern in some blood supply chain studies [1-3]. However, the diminishing number of regular blood donors pose a serious threat to the blood supply chain due to the increasing demand for blood transfusion.
Examining the variability of blood donation patterns is very critical for the health care sector in Zimbabwe. The donors can be classified into four states: new, regular, occasional, and lapsed donors. The assessment of individual blood donor states in the blood bank is vital in understanding the dynamics of the blood donation process. Information on blood donation trends is also crucial for the blood service managers to plan the recruitment and management of blood inventory [4]. Understanding blood donation distribution is equally necessary for future planning. The distribution pattern of individual blood donations in the various identified states, rather than studying the total amount of blood donations within an entire period, is more important and informative for studying the pattern of blood donation occurrences. The behaviour of blood donors is unpredictable since the donors optionally donate their blood. Blood donation exhibits a strong variability in time and space; hence blood donation is a stochastic process full of uncertainty. This uncertainty in blood donation is so high that ordinary non-statistical techniques may yield unsatisfactory results for planning purposes [5].
The blood supply chain depends upon a finite number of donors within any given period. This is aggravated by the fact that blood donation is very irregular and uncertain [6]. Blood managers fear the risk of the blood system failing to meet blood demand requirements in the event of an emergency or disaster occurring [7]. The occurrence of unpredictable public emergency health risks, mandates blood centres staying alert and responsive to fluctuating blood supply and demand [8]. A practical example is the Covid-19 pandemic, which has left many blood centers across the globe grappling with declining blood stocks due to reduced blood donations. It is against this background that blood managers need to constantly monitor the dynamics of the blood donors in the donation pool. This will enable them to make informed decisions and take proactive measures to ensure adequate blood availability when needed. There are several factors that affect blood donation frequency, such as low haemoglobin levels, the interval between donations, gender, age, and exposure to infection.
A Markov chain approach was employed to determine the probability of transitions among the four identified major blood donation categories in Zimbabwe. A Markov chain is a special category of a stochastic process where the state space and time domain are discrete in nature. It is a discrete time-time process for which the future behaviour of the process, given the past and present, only depends on the present and not on the past [9]. It is described by a matrix of transition probabilities from one state to another state [10]. During their blood donation career, a blood donor can stay in a particular state for a long time or stochastically transit from one state to another. Markov chain models can be used to compute the probability and transition frequency associated with each identified blood donation state. The application of the Markov chain in modeling the dynamics of state-dependent blood donation patterns is an unexplored perspective in Zimbabwe’s blood supply chain. Most blood centers in Zimbabwe use expert opinion and intuition rather than science-based approaches. This study modeled the blood donation status using a Discrete Time Markov Chain (DTMC) analysis with a finite state space. The four states, namely: new (N), regular (R), occasional (O) and lapsed (L) donors are identified and used in the analysis.
There is no study in Zimbabwe that adopts an alternative approach that focuses attention on the dynamics of blood donations from donors in the different identified states. This paper fills this gap by adopting a Markov chain approach for analysing blood donation transition frequencies using the Harare-based National Blood Service (in) Zimbabwe (NBSZ) branch as a focal point. The study focused on Zimbabwe, but the models can have a global application in other geographical jurisdictions with similar donor characteristics as found in Zimbabwe. The application of the Markov chain models in the blood supply chain has not received much attention, as in the other fields of study such as finance, hydrology, ecology and meteorology, to mention but a few [11-15]. Few studies have been done regarding the application of the Markov chain in modelling the blood donation process at blood service centres [16]. Most blood centres in Zimbabwe use expert opinion and intuition rather than science-based approaches.
According to [17], a Markov chain is a stochastic process in which the future probability of the process depends only on the present state of the process and is not influenced by its history. A study by [18] predicted future blood supply, demand and shortfalls in blood donations in Japan. They used a Markov model to project future blood donations up to the year 2050 using data from all blood donations from the year 2006 to 2009. Their study focused on the volumes of blood units supplied and demanded, and they used totals of blood donations from specific groups and not individual donation patterns. Donation is driven by individual altruism. Results showed fluctuating numbers of blood donations and are characterized by a yearly decline in the number of donors in the 20 to 30 years age category. The authors concluded that, if the prevailing blood donation trends were to continue, then a shortfall of blood availability was imminent in Japan.
The effects of the issuing policies on average blood inventory levels determine blood shortage probabilities and the average age of blood at transfusion. They developed a theoretical model using the theory of absorbing Markov chains. Results established that regular first in, first out (FIFO) and last in, first out (LIFO) issuing policies did not apply to a blood issuing policy problem under study. Modified FIFO and LIFO policies were adopted. Results showed that under the modified FIFO policy, older blood was issued with a higher probability as compared to newer or fresher blood. On the other end, under the modified LIFO policy, fresher blood was released first from the inventory with a higher probability than the older blood. Furthermore, the study revealed the LIFO policy had a greater probability of resulting in blood supply shortage than the FIFO policy [19]. Brodheim et al. [20] made an evaluation of a class of inventory and distribution policies for blood products subject to variable demand. They applied a finite state Markov chain, which was assumed to be positive recurrent and stationary probabilities exist. Solving a system of steady-state equations, they determined the probability of shortage, the average age of inventory and an average number of discarded blood products. They concluded that the steady-state or long-term average probabilities calculated from their Markov chain matrix were able to estimate defined measures of the inventory policies.
Soraes et al. [20] Studied the inventory management of blood supplies at centralized blood banks. They developed a Markov decision process model focused on minimizing the overall costs in the blood supply chain from blood collections up to the disposal of blood bags. They sought an optimal stationary control policy that minimized the long-term average cost of the inventory. The results from their model indicated that blood collections by external teams outside the central facility increased the quantity of blood in inventory. Hosseinifard [22] modelled the blood donation process with a Markov chain model during a disaster period. Their approach was able to mathematically model the expected value and variance of daily blood donations for repeat donors. The results established that the steady state blood supply chain could be destabilized during a disaster or pandemic, and an urgent blood drive call could then trigger a surge in blood demand. The authors concluded that, the lockout period in which a donor was ineligible to donate, contributed to the decline in blood collections after a blood drive call. Other researchers have used different approaches such as logistic regression and negative binomial regression, in modelling the donation frequency behaviour of blood donations [23].
This study will focus on the transition of individual blood donors from one identified state to another, as this has a bearing on the volume of blood supplied. The study seeks further understanding of blood donation patterns in Zimbabwe. The study describes the pattern of blood donation status at a blood service centre in Harare, Zimbabwe. A total of all the 8312 new voluntary and non-remunerated blood donors in 2014 were retrieved from the donors’ database forming the study population from which a sample of 450 new blood donors was selected. The donors were classified according to the number of times they donated blood within a cycle of 12 months for a period of four years from the year 2014 to the year 2017, resulting in 1812 observations. The findings of this study will provide useful insights to blood service managers to ascertain blood donor recruitment and retention strategies, which have a bearing on the blood supply inventory at the blood centre.
The overall aim of the paper is to present the four-state DTMC model of blood donations over a four-year study period, from January 2014 to December 2017. The specific objectives are:
1) To explore the dynamics of blood donations in different states determined by donation frequencies.
2) To perform the Markov chain analysis based on the transition of individuals between the four identified states.
3) To discuss the implication of the results to blood service managers’ decision-making process.
The sections in this paper are organized as follows: Section 2 presents materials and methods, including model formulation, Section 3 focus on results, and section 4 presents a discussion. Section 5 summarises and concludes the study.
2. MATERIALS AND METHODS
This section describes the data set and the Markov chain technique adopted.
2.1. Description of the Data
The study is based on blood donation data collected in Harare, Zimbabwe over a period of four years, from 1 January 2014 to 31 December 2017. The sample size was calculated by using the Taro Yamane formula, stated as  , where n is the sample size, N is the population of the study and e is the error in the calculation (95% or 0.05). All the 8312 new voluntary and non-remunerated blood donors in 2014 were retrieved from the donors’ database thus forming the study population. From the Taro Yamane formula, the sample size was found to be 382 and was increased by an additional 70 donors to 450 donors to improve the accuracy of the estimates. Random sampling was then used to select the objects of the study. The donors’ specific data on the donor identification number, age, sex, number of donations each year, and interval between whole blood donations and blood group were extracted as secondary data from the NBSZ database. Hence, no ethical considerations were required since there was no direct interaction with the individual blood donors. Furthermore, the identity of the blood donors remained anonymous, only identification numbers were used for each donor. Authority to use the data was granted by the NBSZ Research and Development department. The NBSZ Harare blood bank was chosen as the study site since it is the head office and largest bank of the blood service, where all the blood donation data in Zimbabwe is collated and managed.
2.2. Markov Chain Technique
The Markov chain approach described below was chosen in the study because of its power in modelling the sequence of events that change states over time for each individual. The Statistical analysis was performed using the R software, which is an inbuilt msm version 1.4 developed by Jackson (2011). A four-state Markov chain was used to describe the behaviour of individual blood donation occurrences at the blood service centre. The states under consideration are: new (N), regular (R), occasional (O) and lapsed (L) donors, forming the state space S = {N, R, O, L}. The identified states are determined by the frequency of blood donation for the individual as presented in Table 1. The probability of the process being in a particular state was calculated based on the Markov chain assumption, attaining a state depends on the immediately preceding state only. In the data analysis, a Markov chain was used to determine the stability of the Markov matrix, and the Chi-square was used to test for statistical significance.
| Status | Description (Donation Frequency) |
|---|---|
| 1= New (N) | First time donor |
| 2 = Regular (R) | At least 2 donations within 12 months |
| 3 = Occasional (O) 4 = Lapsed (L) |
One donation within 12 months Last donation was at least 24 months ago |
2.3. Markov Property
To adequately apply the Markov chain model, it is necessary to fulfil the Markov property. The Markov property states that the probability of a future state is independent of the past states and depends only on the present state occupied [24]. The transition probabilities from donor state i to donor state j depend on the current state and not historical blood donation status. In other words, the past status of donations is fully summed up by the mere knowledge of the present state of blood donations. Therefore, blood donation occurrences can be assumed or considered to be a memoryless process.
A discrete-time Markov chain can be described as a sequence of random variables X1, X2, X3,... characterised by the memoryless property or Markov property [25].
The Markov property states that
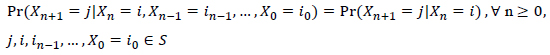 |
(1) |
From Eq. (1), the distribution of the next state (of Xn+1) depends only on the current state (Xn) and not on previous states occupied, Xn-1,Xn-2,...,X1.
The transition from state i to state j is defined by the transition probability pij in Eq. (2) as:
 |
(2) |
Furthermore, the probability of going from state i to state j in n steps is given by Eq. (3) as:
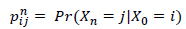 |
(3) |
If the Markov chain is time-homogeneous pij = Pr (Xk+1 = j|Xk = i) and pnij = Pr (Xn+k = j|Xk = i), where  k > 0.
2.4. Transition Frequencies
The data on the transition frequency of donations over the period of study can be modelled as a four-state Markov chain with state space S = {N, R, O, L}.
The transition frequencies are given as the observed transition frequencies of blood donations to a particular state j preceded by the blood donor being in state i at the previous donation period.
2.5. Transition Probability Matrix
It is important to define a transition matrix Pij which gives information on the probability of transitions among the different states in the system under study. The transition matrix probability P = [pij] shows the likelihood of blood donation status staying unchanged or moving to any of the S – 1 categories over the given time horizon.
The transition probabilities from state i to state j can be constructed as the following matrix:
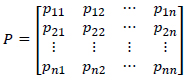 |
The probabilities of transition pij are defined as:
pii- the probability of starting in state i and ending in state i, or remaining in a state i throughout the period.
pij - transition probability from state i to state j,  .
.
When pij is constant and independent of time (time homogeneous), matrix Pij = P is a time homogeneous stochastic matrix. The probabilities must satisfy the following conditions:
pij ≥ 0, i, j = 1,2,3,4 and ∑ pij = 1 i, j = 1,2,3,4
To analyse the Markov model on blood donations, several assumptions were made, viz:
a) Donor transition probabilities are constant over time (time homogeneity).
b) The probability of the donor’s next transition depends only on the current state.
c) The donor either remained in the current state or moved to the next state.
2.6. Estimating Transition Probabilities
A time-homogeneous Markov chain model can be developed from the given data. Different methods such as the Maximum Likelihood Estimation (MLE), Bootstrap approach and Maximum A Posteriori (MAP) can be used in the estimation of the parameters.
Based on the Markov principle, the transition events are independent of one another and hence the likelihood of the transition probability, pij follows a binomial model [26]. The binomial model is given in Eq. (4) as:
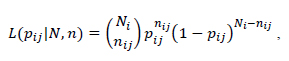 |
(4) |
Where Ni is the number of observed transitions that starts from state i to j and,
 |
(5) |
Following the assumption of constant transition probabilities over the time horizon and Eq. (5), the transition probability is estimated in Eq. (6) as:
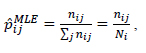 |
(6) |
for i, j = 1, 2, 3,4 and nij is the number of observed transitions from i to j and ∑ j nij = Ni
is the sum of observed transitions from i to j.
The standard errors are expressed in Eq. (7) as:
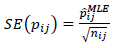 |
(7) |
The asymptotic confidence intervals for pij are expressed in Eq. (8) as:
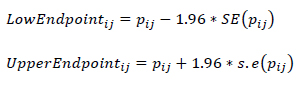 |
(8) |
The associated transition probability matrix is presented as:
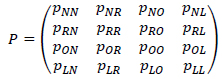 |
Where:
pij - Probability of being in state j preceded by donor being in state i.
The sum of probabilities for each row must be equal to one. For example,
pON + pOR + pOO + pOL = 1
2.7. Transition Graph
A graphical representation of the transition probabilities pij is called a transition graph or diagram. Each possible state of i, j ϵ S, where S = {N, R, O, L} is represented by a circle, and the probabilities of non-zero transitions between the different states are represented by arrows. The graph helps to easily classify the states into recurrent and transient states, and so on.
2.8. Statistical Significance of the Models
A Goodness-of-fit test is conducted to establish whether the data used satisfies the basic assumption of the Markov chain that the current blood donation state depends on the state of the immediate past blood donation. The variations between the observed and expected frequencies can be evaluated using the Chi-square (X2) test. A contingency table of frequency distribution of transitions among states is constructed at (α = 0.05) significance level. To validate the Markov chain models, the hypotheses are stated as:
H0 : Blood donation occurrences are independent
H1: Blood donation occurrences are not independent
At α = 0.05 significance level and degrees of freedom, the X2 critical value and the X2 test values are determined.
H0 is rejected when X2 the test value is greater than the X2 critical value or when the p – value < 0.05.
The X2 test value is calculated as:
 |
Where i, j is the number of categories, and Oij and Eij are observed and estimated values respectively, and
Eij = oi.xo. j / o.. where,
Oi.= ith row marginal total
O.j = jth column marginal total
O.. = Grand total
2.9. Stationary Distributions
2.9.1. Proposition 1
An irreducible, aperiodic Markov chain with a finite state space will settle down to its unique stationary distribution in the long run.
In principle, the vector of steady-state probabilities π = (π1, π2, ... πn) can be obtained by solving the steady-state equations expressed as in Eq. (9)
 |
(9) |
The model solves the steady-state probability distribution of blood donor status in the long run.
2.10. First Passage Time Probabilities
The first passage time from state i to state j is the number Tij of steps taken by the chain until it arrives for the first time at state j given the initial state X0 = i. This is formulated as in Egs. (10 and 11) below:
 |
(10) |
knowing that hij(n) = pij.
Therefore,
 |
(11) |
3. RESULTS AND DISCUSSION
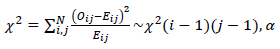
Table 2, which presents the frequency distribution of blood donor states, shows that from the initial 450 new or first-time donors at the beginning of the study (time = 0), 252 (56%) donors had made repeat donations and became regular donors by the end of the first year. These regular donors declined to 228 (50.7%) in year 2 and gradually continued the downward trend as time passed by. Similarly, 198 (44%) of the initial new donors had become occasional donors by the end of year 1. The occasional donors also significantly declined as time progressed. Also, with the passage of time, donors began to lapse from year 2 with 160 (35.6%) donors and the frequency increased to 204 (45.3%) donors in year 3 and 250 (55.6%) donors in year 4. These trends are visually presented by a bar chart in Fig. (1).
| Time Period | |||||
|---|---|---|---|---|---|
| State | 0 | 1 | 2 | 3 | 4 |
| New | 450 | - | - | - | - |
| Regular | - | 252 | 228 | 176 | 153 |
| Occasional | - | 198 | 62 | 70 | 47 |
| Lapsed | - | - | 160 | 204 | 250 |
Fig. (1) shows the dominance of regular donors in year 1 and year 2 of 252 (56%) donors and 228 (50.7%) donors, respectively. However, from year 3 onwards, donors begin to lapse as indicated by higher values of lapsed donors as compared to others in year 3 and year 4 with 204 donors (45.3%) and 250 donors (55.6%) respectively.
3.1. Transition Frequencies
Based on the blood donation frequency classifications, the number of blood donations within the study population at states, namely, new (N), regular (R), occasional (O) and lapsed (L) is presented in Table 3 as transition frequency or counts. Table 3 shows that there are 252 occasions of regular donations observed at the end of the study period from new donations, 266 occasions of lapsed donations observed from occasional donations and 479 occasions of regular donations observed as repeating donations. Regular donations are a reliable source of blood and their high frequency of donations is critical in blood centres. However, with the passage of time, the frequency of donations declines resulting in high occasions of observed lapsed donations.
The accessibility of the regular state from all the other states is of importance as it ensures the sustainability of blood supply.
3.2. Estimating Transition Probabilities
Using the observed transition frequencies of the donor at the beginning of the year and then again at the end of the year, we can estimate the probability of moving from one donation category to another. The probability of a donor being in state j at the end of the year given their initial state i at the beginning of the year is given by a simple ratio of the number of donations that began the year in state i and ended the year in state j to the total number of donations that began the year in state i. Table 4 shows estimates of transition probabilities over the study period using Maximum Likelihood Estimation (MLE), Bootstrap, and Maximum A Posteriori Estimation (MAP) approaches. From Table 4, the MLE and MAP gave the same transition probability matrix (pij) and LL value different from the Bootstrap method. The bootstrap method gives unique transition matrices depending on the number of boots applied and hence different values of the Log Likelihood (LL) functions as well [27]. Even though both the MLE and the MAP have an alternating low and high estimation of the standard errors SE (pij), the MLE has much lower estimations. The maximum likelihood estimation (MLE) was used to estimate the transition probabilities and their respective standard errors.
| To (j) | ||||||
|---|---|---|---|---|---|---|
| From (i) | - | New | Regular | Occasional | Lapsed | Total |
| New | 0 | 252 | 198 | 0 | 450 | |
| Regular | 0 | 479 | 177 | 0 | 656 | |
| Occasional | 0 | 64 | 0 | 266 | 330 | |
| Lapsed | 0 | 14 | 2 | 348 | 364 | |
The transition probability matrix is calculated as: The transition probability matrix is calculated as:
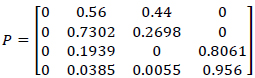 |
| Method | Pij | Pij | LL | ||||||||
|---|---|---|---|---|---|---|---|---|---|---|---|
| MLE | N | R | O | L | N | R | O | L | - | ||
| N | 0 | 0.56 | 0.44 | 0 | N | 0 | 0.0353 | 0.0313 | 0 | -925.15 | |
| R | 0 | 0.7302 | 0.2698 | 0 | R | 0 | 0.0334 | 0.0203 | 0 | ||
| O | 0 | 0.1939 | 0 | 0.8061 | O | 0 | 0.0242 | 0 | 0.0494 | ||
| L | 0 | 0.0385 | 0.0055 | 0.956 | L | 0 | 0.0103 | 0.0039 | 0.0512 | ||
| Bootstrap | R | O | L | - | R | O | L | - | |||
| R | 0.511 | 0.489 | 0 | - | R | 0.1116 | 0.1116 | 0 | - | -1625.3 | |
| O | 0.1336 | 0.2145 | 0.6519 | - | O | 0.0302 | 0.1092 | 0.0805 | - | ||
| L | 0.0364 | 0.0779 | 0.8857 | - | L | 0.0061 | 0.0268 | 0.1458 | - | ||
| MAP | N | R | O | L | N | R | O | L | - | ||
| N | 0 | 0.56 | 0.44 | 0 | N | 0.0022 | 0.0233 | 0.0233 | 0.0022 | -925.15 | |
| R | 0 | 0.7302 | 0.2698 | 0 | R | 0.0015 | 0.0173 | 0.0173 | 0.0015 | ||
| O | 0 | 0.1939 | 0 | 0.8061 | O | 0.003 | 0.0216 | 0.03 | 0.0219 | ||
| L | 0 | 0.0385 | 0.0055 | 0.956 | L | 0.0027 | 0.0103 | 0.0047 | 0.0115 | ||
The transition matrix P shows the probability of moving from a new donation state to a normal state is 0.56, implying that nearly half of first-time donors return to donate blood in the early stages of their donation career. This also means that 44% of the first-time do not return to give blood in the first cycle and this assessment agrees with conclusions made by other researchers [28-30].
The probability of remaining in the normal donation state is 0.7302, which is fairly high compared to the probability of moving from a normal state to an occasional state. The probabilities of moving from the occasional donation state to a lapsed donation state and the probability of remaining in the lapsed donation state are 0.8061 and 0.956 respectively. They are very high. This means that, once the donor becomes sporadic in the donation pattern, there is a very high likelihood of lapsing. At the same time, lapsed donors have a higher tendency (0.956) of not returning to donate blood. This implies that, blood donor retention is a challenge in most blood centers as more reliable donors are lost or become dormant in their blood donation career.
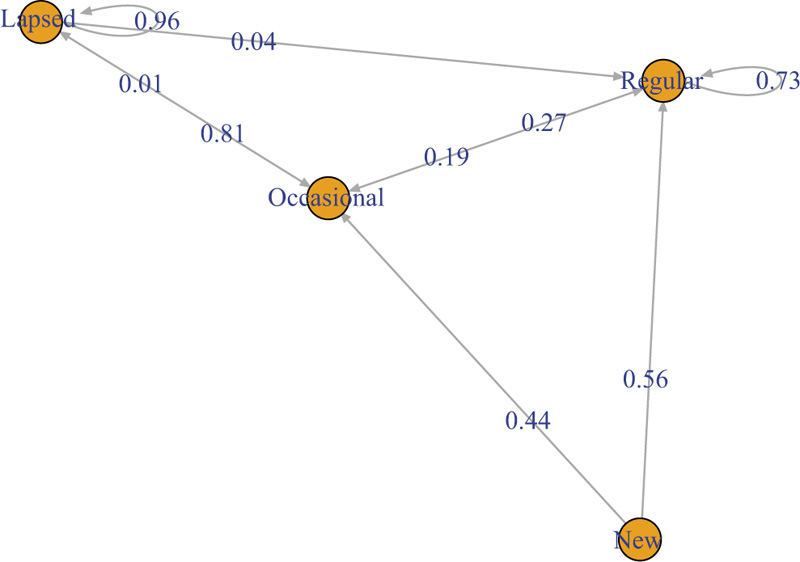
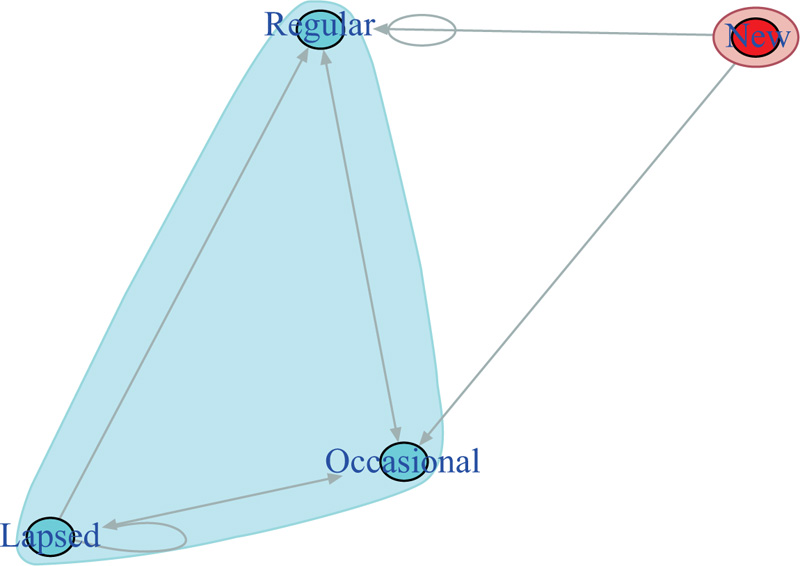
To further analyse the dynamics of the blood donation process, a transition diagram in Fig. (2) is used to represent the transition probabilities for blood donations.
Fig. (2) is a summary of the state classifications and concludes that, state {New} is transient, since upon leaving the state, there is no positive probability of returning to its original state. In other words, once a blood donor donates for the first time as a new donor, that state cannot be entered again. On the other end, states {Regular, Occasional, Lapsed} are recurrent and closed classes. Once blood donation occurs in a particular state, return to the state can happen again several times.
It can be deduced that the Markov chain is not irreducible (reducible) and is aperiodic.
Since the irreducibility property does not hold, a higher dimensional approach was used. The igraph in Fig. (3) shows that the communicating class has strongly connected components of the underlying DTMC.
Since the Markov chain was not irreducible (reducible), it was then decomposed into transient (Tk) and recurrent (Rk) classes. The canonical decomposition of the state space, which is a union of closed communicating states can be presented as:
S = Transient (Tk) Closed recurent class (Rk)
{New, Regular, Occasional, Lapsed} = {New} { Regular, Occasional, Lapsed }
The initial probability to be in a communication class remain constant because the communication class is closed. Conditioned on being in the communicating class, the probability distribution of the state is given by the stationary distribution associated with the closed communicating class.
The limit probability for the transient class is null [π1 = 0]. The steady state probabilities can be calculated for states 2,3 and 4 as [π2, π3, π4].
3.3. Statistical Significance of the Models
A contingency table of the frequency distribution of transitions among states was constructed at (α = 0.05) significance level as in Table 5 to test the hypotheses:
H0: Blood donations occurrence are independent
H1: Blood donations occurrence are not independent
The existence of a marginal total of zero for the new state means that the expected frequencies will be less than 5.
The significant test was then carried out using Fisher’s test with a simulated-p-value to cater to the problem of computational space and very long running times of the R statistical programme.
The Fisher's exact test for count data with simulated p-value (based on 2000 replicates) yielded a p-value = 0.0004998 ~ 0.0005. Since the p-value from the output is less than the significance level of 5% p-value = 0.0005 < 0.05), we can reject the null hypothesis and hence conclude that there is a significant relationship between the donations occurrence.
| To (j) | ||||||
|---|---|---|---|---|---|---|
| From (i) | - | New | Regular | Occasional | Lapsed | Total |
| New | 0 | 252 (202.25) * | 198 (94.25) | 0 (153.5) | 450 | |
| Regular | 0 | 479 (294.83) | 177 (137.4) | 0 (223.77) | 656 | |
| Occasional | 0 | 64 (148.32) | 0 (69.12) | 266 (112.56) | 330 | |
| Lapsed | 0 | 14 (163.6) | 2 (76.23) | 348 (124.17) | 364 | |
| Total | 0 | 809 | 377 | 614 | 1800 | |
Therefore, it can be concluded that the current blood donation state depends on the state of the immediate past blood donation.
3.4. Forecasting Future Blood Donation State
In the long run, no donors will move back to become new donors. Therefore, in order for the stationary distribution to exist, the P matrix was reduced to a 3 x 3 P* matrix by excluding the {New} state.
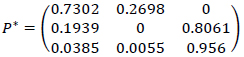 |
Thus, the steady-state equations are given in Eq. (12) as:
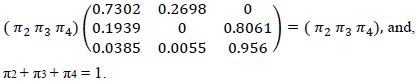 |
(12) |
Solving the system of equations yielded the following steady state probabilities in Eq. (13).
 |
(13) |
The stationary distribution in Eq. (13), means that about 14.7% of the blood donations become regular in the long run. A cause for concern to the blood managers is that, 80.9% of blood donations become lapsed in the long run. This entails that, blood service managers should have strategies in place to recruit and retain donors and promote regular donations all the time. Occasional donations have a small proportion of 4.4% and therefore, are not a very dependable source of blood since they have a higher likelihood of lapsing.
3.5. Mean Recurrence Time
The mean recurrence time Ri gives the expected number of steps to go back to a state if it was the initial one (expected first return time) for each recurrent state in the transition probabilities matrix. This can also be expressed as:
 |
where, π = [πi] where i = 2, 3, 4 are the recurrent states.
The mean recurrence time for each of the recurrent states are presented in Table 6.
| State | πi | Ri |
|---|---|---|
| Regular | 0.1471291 | 6.796754 |
| Occasional | 0.04414342 | 22.653433 |
| Lapsed | 0.8087275 | 1.236510 |
Once the donor enters the lapsed state, the expected time to return to the state is 1.2 steps (years) which imply that once in the lapsed state, the donor is a step away from lapsing again. In other words, if the donor is in the lapsed state, we expect another lapsed state in the next 1.2-time steps.
In general, the table shows that the lapsed state is most likely to be returned to if it was the initial state. With the passage of time, the lapsed state will be more frequent as compared to the other states. Returning to the occasional state after leaving it is less frequent. Returning to a regular state after leaving it is moderate (6.8 steps) and it is crucial that regular donations are more frequent than any other category. In the case of occasional donations, returning to the same state is nearly impractical (22.7 steps) as compared with other states, hence the probability of zero in the transition probabilities matrix.
3.6. First Passage Time Probabilities
The analysis estimates the time at which the Markov chain visits a particular donation state for the first time. Starting with the new state, the first passage time from the new state to the regular state, or the occasional state or lapsed state, is given by the following number of transitions made by the process from the new state to any of the states for the first time during the study period.
| Time | New | Regular | Occasional | Lapsed |
|---|---|---|---|---|
| 1 | 0 | 0.56 | 0.44 | 0 |
| 2 | 0 | 0.085316 | 0.151088 | 0.3546840 |
| 3 | 0 | 0.01365533 | 0.11032446 | 0.1217920 |
| 4 | 0 | 0.01343275 | 0.08055892 | 0.1074876 |
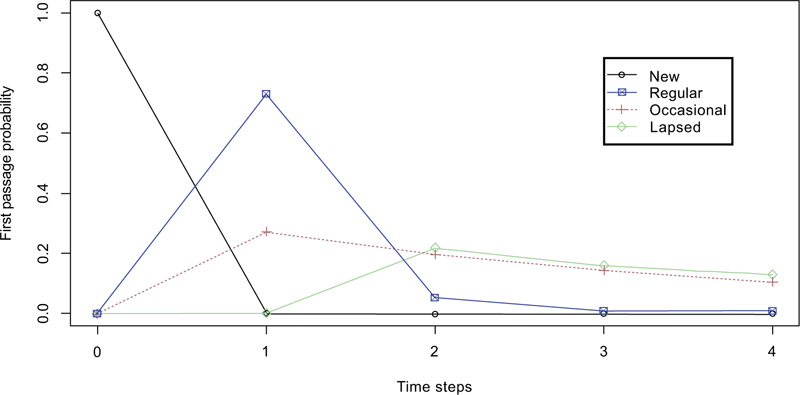
Table 7 shows that if the current state is new, there is a higher likelihood of a regular state (0.56) in the next time step than that of experiencing an occasional state. An associated plot of first transition probabilities across time steps from 0 to 4 when the initial state is new, is shown in Fig. (4).
Fig. (4) clearly depicts the first passage time and probability when the initial state is new. It shows a great chance of regular donation state in the next time step.
| Time | New | Regular | Occasional | Lapsed |
|---|---|---|---|---|
| 1 | 0 | 0.7302 | 0.2698 | 0 |
| 2 | 0 | 0.052314220 | 0.1970080 | 0.2174858 |
| 3 | 0 | 0.008373203 | 0.1438552 | 0.1588081 |
| 4 | 0 | 0.008236719 | 0.1050431 | 0.1273393 |
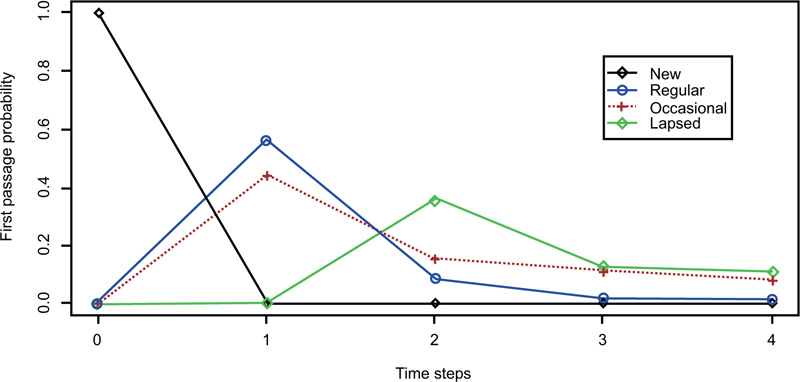
Table 8 shows that the probability of a regular donation in the following time step (0.7302) if the current state is regular is significantly greater than those of experiencing an occasional or lapsed donation. This is also depicted by the plot of first transition probabilities across time steps from 0 to 4 when the initial state is regular, shown in Fig. (5). Fig. (5) shows the dominance of regular donation from 0 up to 1.7-time steps.
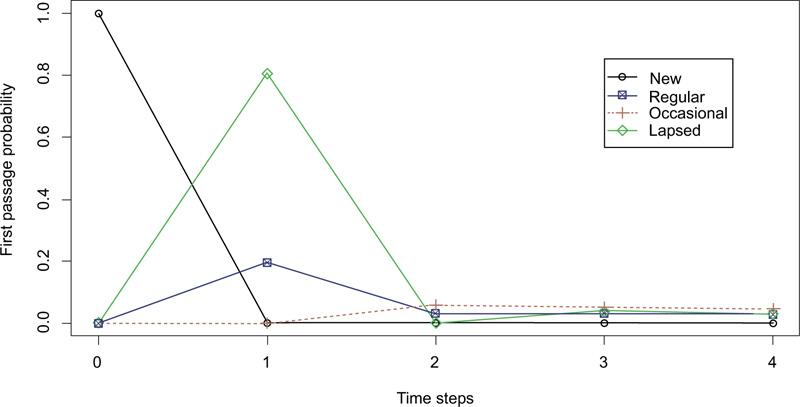
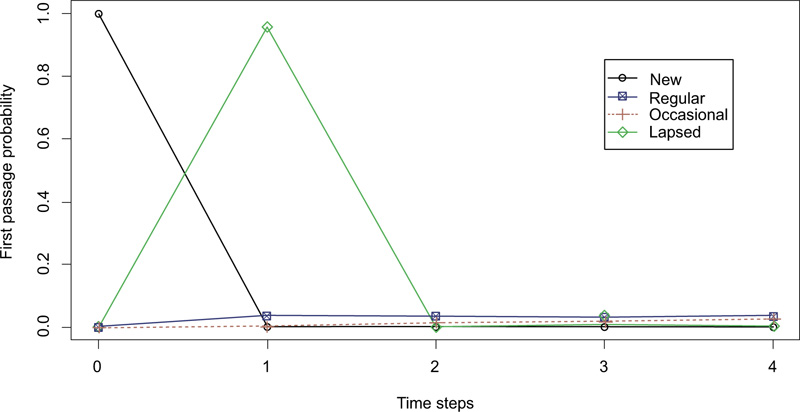
Table 9 below shows that if the current state is an occasional donation, then there is a very high chance of a lapsed donation (0.8061) in the following time step.
Similarly, Table 10 shows that the probability of a lapsed donation in the following time step if the current state is lapsed donation is very high (0.956) compared to those experiencing a regular or occasional donation in the following time step.
| Time | New | Regular | Occasional | Lapsed |
|---|---|---|---|---|
| 1 | 0 | 0.1939 | 0 | 0.8061 |
| 2 | 0 | 0.03103485 | 0.05674777 | 0 |
| 3 | 0 | 0.03052898 | 0.05081152 | 0.04217049 |
| 4 | 0 | 0.02932330 | 0.04606440 | 0.03079289 |
| Time | New | Regular | Occasional | Lapsed |
|---|---|---|---|---|
| 1 | 0 | 0.0385 | 0.0055 | 0.956 |
| 2 | 0 | 0.03787245 | 0.01564530 | 0.004433550 |
| 3 | 0 | 0.03637675 | 0.02254171 | 0.008373203 |
| 4 | 0 | 0.03494409 | 0.02708830 | 0.006346050 |
Figs. (6 and 7) show greater probabilities of a lapsed donation state in the next time step if the current state is an occasional or lapsed donation, respectively.
4. DISCUSSION
The main aim of this study is to provide information on blood donor behaviour throughout their donation career. Blood donor behaviour influences blood bank levels. The study suggested that discrete-time Markov chains can be used to model blood donor status changes throughout the blood donation career.
The Markov chain model is used to describe changes in blood donor status over a four-year period. This is achieved using blood donation data from the NBSZ’s Harare blood centre in Zimbabwe as a case study. The study systematically evaluated the performance of a Markov chain model in which a blood donor may experience more than one type of event during their donation career. The events are described as transitions between four states, viz: new, regular, occasional and lapsed states. The study is an alternative method for the analysis of multiple outcomes in a longitudinal construct to the blood donor behavioural problem. This approach has the advantage of preserving information from individuals being followed up, which is not the case with other statistical techniques such as logistic regression.
The analysis showed that the blood donation process could be described as a stochastic process that satisfies the Markov property. The Fisher's exact test was used to test for the significance of the models, hence the justification of the application of the Markov chain technique. The p-value from the Fisher’s test output was less than the significance level of 5% (p – value = 0.0005 < 0.05), hence the null hypothesis of independent blood donation occurrences was rejected. This means that there was a significant relationship between the donation occurrences. This led to the conclusion that the current blood donation state depended on the state of the immediate past blood donation.
The transition probabilities, steady state probability distribution, mean recurrence time and first passage time probabilities were determined using the blood donation data collected. These statistics are vital in making inferences about the blood donor population and blood bank levels. First passage time probabilities give invaluable insights into the transitions of first-time donors. New donors had a higher likelihood (0.56) of transitioning to a regular state in the next time step when compared to any other state. This is a positive indicator to decision-makers, that at least half of the new donors would return to donate in the next donation period. On the other hand, occasional donors had a very high chance of transitioning to lapsed donors (0.8061) in the following time step, thus depleting the blood donor pool.
The maximum likelihood estimation (MLE) method was used to estimate the transition probabilities, which formed the backbone of the study. The transient nature of the regular, occasional and lapsed donations states allowed blood donation to occur in a particular state with the possibility of returning to that state again several times. The irreducibility property was attained using a higher dimensional approach and canonical decomposition, thus enhancing the existence of steady state distribution. The analysis shows that 44% of first-time donors do not return for further donations in the long run. This confirms conclusions by other researchers that a significant proportion of first-time donors do not become repeat donors [30, 31]. Blood banks are often faced with perennial problems of reduced donation frequencies and donor lapsing. This was also evidenced by the steady state probabilities, with about 80.9% of blood donors lapsing in the long run compared to 14.7% of the blood donors becoming regular in the long run. This calls for blood service managers to put interventions in place that promote blood donor retention to safeguard the sustainability of the blood inventory. Other researchers have associated the dynamics in blood donor state transitions to socio-demographic characteristics of blood donors since they are deemed to have a bearing on blood donation patterns [29, 32].
CONCLUSION
The analysis in this paper provides some insights into the transition probabilities among the blood donor states, and this has implications for future blood donors’ pool and blood bank inventory in Zimbabwe. The paper presented an approach for modelling blood donation states based on a four-state discrete-time Markov chain (DTMC) using the blood donation data collected for four consecutive years. The Markov chain approach has been shown to be a plausible model through conceptual and statistical analysis. The findings have implications for studies in which blood donor status is of interest, especially in donor recruitment, retention and other blood bank inventory management strategies in Zimbabwe. The study results have shown that the Markov chain models established richer insights about the changes in blood donor status over time. The decline in the number of donors who make repeat donations is a worrisome trend, since regular donations are the lifeline of any blood service centre.
The transition probability matrix was used to explain the dynamics of changes in the blood donation process and blood donor status. A time-homogeneous Markov chain was fitted from the given blood donation data. The maximum likelihood estimator (MLE) was employed to estimate the
Depending on the current state of donation, if either new or regular donation is the current state, donors are likely to move to regular donation in the following time step (year). Similarly, if the current state is either occasional or lapsed, then there is a greater probability of a donor being in the lapsed donation state in the following time step (year).
The results from this study will help blood service managers to make informed decisions in future planning and policy formulation in the blood supply chain. Such policies are mainly on the interventions to sustain the supply of blood such as blood donor recruitment and retention. With a greater proportion of donors becoming inactive, as indicated by the results, blood authorities need to be proactive and motivate new and occasional donors to return for further donations than be reactive when blood is in short supply.
LIST OF ABBREVIATIONS
| DTMC | = Discrete Time Markov Chain |
| NBSZ | = National Blood Service Zimbabwe |
| WHO | = World Health Organisation |
AUTHORS’ CONTRIBUTIONS
Coster contributed to the study conceptualisation and design, literature, data collection and analysis, results from interpretation and the manuscript write-up. Delson reviewed and corrected misconceptions and approved the manuscript for submission.
ETHICS APPROVAL AND CONSENT TO PARTICIPATE
Not applicable.
HUMAN AND ANIMAL RIGHTS
No animals/humans were used for studies that are the basis of this research.
CONSENT FOR PUBLICATION
The objectives of the study were explained to the NBSZ business executive development manager in charge of research activities who gave his consent for the publication of the research.
AVAILABILITY OF DATA AND MATERIALS
The dataset used during the current study is not available for sharing with the public as agreed between the corresponding author [C.C] and NBSZ senior authorities.
FUNDING
None.
CONFLICTS OF INTEREST
The authors declare no conflict of interest, financial or otherwise.
ACKNOWLEDGEMENTS
The authors would like to extend their sincere gratitude to the National Blood Service Zimbabwe (NBSZ), especially to Dr. Tonderai Mapako for his critical role in facilitating access to the data used in this study. The authors also thank the other NBSZ staff who found time to extract and compile the data from the donors’ database.

