All published articles of this journal are available on ScienceDirect.

Psychological Distress in Rapidly Urbanizing Settings: A Cross-Sectional Study of Structural Pathways Linking Age, Blood Pressure, and Metabolic Health
 Yohanes Firmansyah2
Noer Saelan Tadjudin1
Ernawati Ernawati3
Alexander Halim Santoso4
Triyana Sari5
Muhammad Fikri Dzakwan6
Diana Dinali6
Bryan Anna Wijaya6
Ronald Winardi Kartika7
Hendsun Hendsun8
Authors Info & Affiliations
Abstract
Introduction
Depression, anxiety, and stress have become significant public health issues in rapidly urbanizing environments, especially among younger and working-age individuals facing escalating social, economic, and vocational demands. Urban surroundings are increasingly associated with metabolic disorders, such as changed body composition, dyslipidemia, and hypertension, which may influence psychological outcomes. Nonetheless, integrated models investigating the correlations between age, metabolic status (including skeletal muscle mass, body fat composition, and dyslipidemia), and psychological outcomes within urban adult populations are scarce.
Objective
This study aimed to construct and assess a structural model delineating the interconnections among age, metabolic status (skeletal muscle mass, body fat composition, and dyslipidemia), and psychological consequences, such as depression, anxiety, and stress, in urban adults in Jakarta.
Method
A cross-sectional study was conducted in 2025 across five administrative regions of Jakarta. A total of 1,123 adults aged 18-98 years were recruited using consecutive sampling. Psychological distress was assessed using the Depression Anxiety Stress Scale-42 (DASS-42). Body composition, muscle strength, blood pressure, and biochemical markers were measured using standardized instruments and laboratory procedures. Data were analyzed using SPSS version 25 for univariate, bivariate (Spearman correlation), and age-controlled partial correlation analyses, followed by Partial Least Squares-Structural Equation Modeling (PLS-SEM) using SmartPLS version 3 to estimate path coefficients and explained variance (R2).
Results
PLS-SEM analysis revealed that younger age was associated with greater psychological distress (β = −0.116; R2 = 0.042), whereas age was positively associated with blood pressure (β = 0.278). Blood pressure was inversely associated with psychological distress, while dyslipidemia and body fat profile demonstrated only minimal direct effects. Skeletal muscle status was more strongly related to physiological markers than to psychological distress.
Discussion
Hypertension and psychological distress in urban populations are increasingly recognized among younger, working-age adults rather than being exclusively associated with aging. Urban adults, many of whom belong to the “sandwich generation,” may experience concurrent responsibilities of supporting both aging parents and dependent children while maintaining career progression, creating psychosocial pressures that could influence cardiovascular and metabolic health. Importantly, the findings suggest that physical fitness alone may provide limited protection against psychological distress in these high-stress environments, highlighting the importance of broader structural interventions, including healthier workplaces, strengthened social protection, expanded green spaces, and the promotion of early hypertension screening and risk identification among urban adults.
Conclusion
Psychological distress in urban people was only marginally elucidated by metabolic and physiological parameters, but cardiovascular and musculoskeletal outcomes exhibited more pronounced correlations with age and hemoglobin levels. The findings indicate that mental health outcomes in urban populations are influenced by multiple factors and are not exclusively determined by biological aging, underscoring the significance of larger structural and environmental variables in increasingly urbanizing settings.
1. INTRODUCTION
Depression, anxiety, and stress have become significant health challenges in urban environments worldwide, especially among young individuals contending with fierce labor market rivalry, economic instability, and swift societal transformation. Population-based studies from various countries reveal that nearly one in three adults experience moderate-to-severe depression, anxiety, and stress, with prevalence of approximately 27.8%, 30.5%, and 30.7%, respectively, in a Turkish adult sample (mean age 27 years) during the pandemic, predominantly residing in urban areas [1]. Global data indicates that younger age cohorts experience roughly twice as much psychological distress as older adults, with documented prevalence rates of anxiety and depression at 42.6% and 39.5% among adults in the United States [2]. These factors are further intensified by modern urban pressures, such as employment instability, prolonged digital exposure, and the disintegration of social networks that dampen conventional coping strategies [3].
The prevalence of emotional and mental problems in Asia, especially the middle-income nations experiencing swift urbanization, has shown a steady increase. A community-based study in Malaysia found the prevalence of depressive symptoms was 23.9%, anxiety was 41.7%, and comorbid depression with anxiety was 19.9% among urban populations. Significant risk factors identified were female gender, diminished quality of life, and increased social stress associated with the pandemic and economic changes [3]. Multinational research in the Asia-Pacific region has similarly shown that adolescents and young adults exhibit higher rates of depression and anxiety than older age groups; for instance, studies utilizing the DASS-21 indicated prevalence rates of 53.7% for depression and 61.5% for anxiety among university students, significantly surpassing the corresponding rates of 7.2% and 22.5% found in older adults [4]. At the regional level, persistent social structural transformations, such as the transition to fewer family units, increasing productivity demands, and heightened educational and professional competition, have exacerbated social pressures among urban young people [5].
In Indonesia, swift urbanization and population density in large cities are anticipated to increase the risk of depression, anxiety, and stress, especially among those of working age. While national data derived from DASS-42 for urban adult populations is scarce, numerous studies from Asian contexts with similar sociodemographic traits indicate trends that may resonate with the Indonesian scenario. Research in Hong Kong involving university students (mean age 20 years) revealed prevalence rates of 40.0% for depression, 50.7% for anxiety, and 22.2% for stress, with academic pressure and future uncertainty recognized as the main stressors [5]. In Malaysia, urban populations affected by the COVID-19 pandemic demonstrated a notable rise in depressive and anxiety symptoms, especially among younger demographics facing diminished quality of life and increased economic difficulties [3]. The Indonesian context, marked by escalating living expenses, heightened labor market competition, and the rise of the “sandwich generation” among individuals aged 25-45, defined as working-age adults who concurrently support dependent children and aging parents, may produce similar social pressures for young adults in major urban centers like Jakarta. These cities are predominantly inhabited by individuals of working age, encompassing both informal and formal sector employees who frequently endure extended working hours and financial instability [6-8].
In Jakarta, as a metropolitan city, social pressures among young adults have become increasingly complex. Aside from career and economic demands, individuals also experience dual burdens as the family breadwinners and caregivers for aging parents, while simultaneously needing to adapt to a predominantly sedentary urban lifestyle [9-12]. Metabolic problems in sedentary lifestyles present a significant risk to the physical health of metropolitan populations. Metabolic syndrome, as characterized by central obesity, dyslipidemia, hypertension, and hyperglycemia, impacts roughly 20-60% of the adult population worldwide, with a notable increase in the Asia-Pacific area and a higher incidence among urban people compared to rural ones. Research in China has shown a rising incidence of metabolic syndrome in people aged ≥20 years, especially women, urban residents, and those with poor physical activity levels [13]. Research conducted in India and Korea found that the prevalence of metabolic syndrome among young adults aged 20-39 ranges from 3% to 12%, with a significant number displaying at least one metabolic risk factor, including central obesity, elevated triglycerides, low HDL cholesterol, or hypertension. The data suggest that diminished muscle mass, excessive body fat, dyslipidemia, and the onset of additional metabolic risk factors manifest throughout the productive age, particularly in metropolitan settings marked by high-calorie diets and low physical activity levels [14-18]. The interplay of mental health issues (depression, anxiety, and stress) with metabolic problems constitutes a “double burden” that jeopardizes the long-term health of urban young adult populations, including residents of Jakarta [9-12].
This study seeks to construct and evaluate a structural model that delineates the interrelations among fundamental demographic attributes (age), metabolic conditions (muscle mass, body fat, and dyslipidemia), and psychological outcomes, specifically depression, anxiety, and stress, within urban adult and elderly populations, taking into account global, regional, and national contexts, as well as the distinctive features of major metropolitan areas such as Jakarta.
2. MATERIAL AND METHODS
2.1. Study Design, Setting, and Period
This study employed a cross-sectional design. Data collection was conducted throughout 2025 from across five administrative regions of the Special Capital Region of Jakarta, namely West Jakarta, North Jakarta, East Jakarta, Central Jakarta, and South Jakarta, representing urban populations with diverse population densities and social dynamics.
2.2. Study Population and Sample
The target population was adult residents living in urban areas of Jakarta. The study sample consisted of individuals who met the predefined inclusion and exclusion criteria and consented to participate in all study procedures. Consecutive sampling was applied, whereby all eligible participants encountered during the data collection period were recruited sequentially until the required sample size was achieved. The minimum sample size was determined using an a priori power analysis for multiple linear regression as a conservative approximation for the structural model. The effect size was calculated as f2 = R2/(1 - R2). Assuming a small effect size of f2 = 0.015, a two-sided significance level of α = 0.05, statistical power of 90% (1 - β = 0.90), and five predictors, the minimum required sample size was 1,104 participants.
2.3. Inclusion and Exclusion Criteria
Inclusion criteria were as follows: 1) Adults aged ≥18 years, 2) Residency in one of the five administrative regions of Jakarta, 3) Ability to communicate effectively and comprehend study instructions, 4) Willingness to participate and provision of written informed consent.
Exclusion criteria included: 1) Pregnancy, 2) History of clinically diagnosed severe psychiatric disorders, 3) Acute medical conditions or terminal chronic illnesses, 4) Incomplete physical, psychological, or laboratory data, which could result from contraindications to specific measurements, such as musculoskeletal injuries limiting handgrip assessment, implanted electronic devices (e.g., pacemakers) affecting bioelectrical impedance analysis, or other medical conditions that precluded safe or accurate examination.
2.4. Study Procedures
Data collection was coordinated with local subdistrict authorities or designated community coordinators to facilitate participant recruitment within community settings. Eligible participants underwent a structured assessment protocol that included interviews, psychological questionnaire administration, physical examination, body composition measurements, and venous blood sampling. All procedures were performed by trained healthcare personnel in accordance with standardized operating procedures.
2.5. Study Variables and Measurement Instruments
2.5.1. Psychological Variables
Psychological status was assessed using the Depression Anxiety Stress Scale-42 (DASS-42), consisting of 42 items with 14 items each assessing depression, anxiety, and stress. Responses were recorded on a 4-point Likert scale (0-3) ranging from never to very often, based on experiences over the preceding two weeks. Normal score thresholds, based on prior validation studies, were defined as 0-9 for depression, 0-7 for anxiety, and 0-14 for stress [19].
2.5.2. Body Composition and Muscle Function
Body composition was measured using the Omron Karada Scan HBF-375, which assessed total body fat percentage, visceral fat level, total subcutaneous fat, and total and segmental skeletal muscle mass.
Muscle strength was evaluated using handgrip strength measured with a CAMRY EH-101 handgrip dynamometer. Two measurements were taken from each hand, and the mean value was used for analysis.
2.5.3. Anthropometry and Blood Pressure
Body height was measured using a GEA HT721 Digital Stature Meter, while systolic and diastolic blood pressure were measured using a digital Omron sphygmomanometer following standardized measurement protocols.
2.5.4. Biochemical Blood Parameters
Venous blood samples were collected after a minimum fasting period of 8 hours. The lipid profile, including total cholesterol (TC), low-density lipoprotein cholesterol (LDL-C), high-density lipoprotein cholesterol (HDL-C), and triglycerides (TG), was measured using the NESCO BL-101 5-in-1 Lipid Panel Monitoring System (NESCO, China) with the BLS-101 Lipid Panel Test Cartridge. Reference ranges were <200 mg/dL for TC, <100 mg/dL for LDL-C, ≥40 mg/dL for HDL-C in men and ≥50 mg/dL in women, and <150 mg/dL for TG.
Fasting blood glucose, hemoglobin, and uric acid were measured using the FORA 6 Multi-Functional Monitoring System (ForaCare Suisse AG, Switzerland) with the corresponding manufacturer-specific test strips. The reference range for fasting blood glucose was 70-99 mg/dL. Hemoglobin reference ranges were 13.5-17.5 g/dL for men and 12.0-15.5 g/dL for women, while uric acid reference ranges were 3.4-7.0 mg/dL for men and 2.4-6.0 mg/dL for women.
Aspartate aminotransferase (AST/SGOT) and alanine aminotransferase (ALT/SGPT) were measured in serum using ALTADEL SGOT and ALTADEL SGPT reagents (PT Setia Anugrah Medika, Indonesia), respectively, using the IFCC-recommended UV enzymatic method on an automated clinical chemistry analyzer. The ALTADEL SGOT reagent was supplied as R1 2 × 50 mL and R2 1 × 25 mL (AKD No. 20101324555), while the ALTADEL SGPT reagent was supplied as R1 2 × 50 mL and R2 1 × 25 mL (AKD No. 20101324580).
Serum creatinine was measured using ALTADEL Creatinine reagent (PT Setia Anugrah Medika, Indonesia) according to the manufacturer's instructions and laboratory standard operating procedures. The reagent was supplied as R1 1 × 50 mL and R2 1 × 50 mL (catalog/e-catalog product No. 76413965). AST, ALT, and creatinine concentrations were reported in U/L, U/L, and mg/dL, respectively. Reference intervals were based on the laboratory-specific reference ranges applicable during the study period.
2.6. Statistical Analysis
Data analysis was conducted in a stepwise and systematic manner using IBM SPSS Statistics version 25 and SmartPLS version 3, in accordance with the study objectives and the characteristics of the variables.
Data completeness, plausibility, and distribution were evaluated to identify missing values, outliers, and data entry errors. Univariate analysis was then performed to describe the characteristics of participants. Bivariate analysis was conducted using Spearman’s rank correlation test, given the non-normal distribution of several variables, to explore crude associations between psychological outcomes (depression, anxiety, and stress) and cardiometabolic, body composition, and biochemical parameters. To further isolate associations independent of chronological aging, partial correlation analyses controlling for age were performed in SPSS 25, allowing the identification of relationships that persisted beyond age-related effects. Following exploratory analyses, variables were grouped into theoretically driven latent domains and imported into SmartPLS 3 for Partial Least Squares-Structural Equation Modeling (PLS-SEM). Study variables were grouped into latent domains comprising dyslipidemia (HDL, LDL, triglycerides, total cholesterol), body fat profile (total body fat, visceral fat, total and segmental subcutaneous fat), blood pressure (systolic and diastolic blood pressure), muscle quantity and quality (skeletal muscle index, handgrip strength, total skeletal muscle mass), and psychological distress (depression, anxiety, and stress). All indicators underwent linearization procedures and met the assumptions required for model testing.
PLS-SEM was selected due to its suitability for complex models involving multiple latent constructs, non-normal data distributions, and mixed indicators. Prior to structural model estimation, all indicators underwent linearization and standardization to ensure comparability across measurement scales. The measurement model was evaluated to confirm indicator relevance within each latent construct, followed by assessment of the structural model to estimate path coefficients (β) and explained variance (R2) for each endogenous construct [20].
3. RESULTS
This study had 1,123 participants from Jakarta, including people aged 18 to 98 years, who met the inclusion criteria. Participants were chosen from metropolitan community environments and received thorough evaluations encompassing sociodemographic attributes, psychological conditions (depression, anxiety, and stress), blood pressure, anthropometric measurements, muscle strength, body composition, and biochemical indicators (Table 1).
| Variable | N (%) | Median (Min - Max) |
|---|---|---|
| Gender • Male • Female |
420 (37,4%) 703 (62,6%) |
|
| Ages, years | 38 (18 - 98) | |
| Depression • Normal • Mild • Moderate • Severe • Extremely Severe |
881 (78,5%) 121 (10,8%) 88 (7,8%) 21 (1,9%) 12 (1,1%) |
4 (0 - 40) |
| Anxiety • Normal • Mild • Moderate • Severe • Extremely Severe |
662 (58,9%) 121 (10,8%) 214 (19,1%) 75 (6,7%) 51 (4,5%) |
6 (0 - 34) |
| Stress • Normal • Mild • Moderate • Severe • Extremely Severe |
944 (84,1%) 100 (8,9%) 64 (5,7%) 10 (0,9%) 5 (0,4%) |
8 (0 - 40) |
The Spearman correlation analysis demonstrated a pattern of bivariate correlations among psychological, cardiometabolic, biochemical, and body composition variables as illustrated in Table 2. Numerous indices of cardiometabolic burden and body composition showed strong relationships with psychological consequences. Simultaneously, indicators of musculoskeletal health and functional capacity exhibited inverse or diminished correlations with psychological discomfort, suggesting a possible protective effect of superior physical condition. These findings emphasize the interrelation between mental and physical health in an urban adult demographic, while also indicating that the identified associations are correlational and may be affected by age-related factors (Table 2).
| 1 | 2 | 3 | 4 | 5 | 6 | 7 | 8 | 9 | 10 | 11 | 12 | 13 | 14 | 15 | 16 | 17 | 18 | 19 | 20 | 21 | 22 | 23 | 24 | 25 | 26 | 27 | 28 | 29 | 30 | |
|---|---|---|---|---|---|---|---|---|---|---|---|---|---|---|---|---|---|---|---|---|---|---|---|---|---|---|---|---|---|---|
| Age (years) (1) | 1.000 | -.098** | -.149** | -.140** | .336** | 0.046 | -0.020 | -.236** | -.173** | -.133** | .105** | .221** | .305** | .126** | .152** | 0.044 | 0.008 | -.315** | -.376** | -.179** | -.206** | -.306** | .211** | -.141** | .208** | .115** | .125** | 0.055 | .197** | .192** |
| 0.001 | 0.000 | 0.000 | 0.000 | 0.124 | 0.499 | 0.000 | 0.000 | 0.000 | 0.000 | 0.000 | 0.000 | 0.000 | 0.000 | 0.136 | 0.777 | 0.000 | 0.000 | 0.000 | 0.000 | 0.000 | 0.000 | 0.000 | 0.000 | 0.000 | 0.000 | 0.068 | 0.000 | 0.000 | ||
| Depression Score (2) | -.098** | 1.000 | .802** | .831** | -.158** | -.127** | -.135** | -.097** | -0.057 | -.115** | -.111** | 0.008 | -.122** | 0.017 | 0.009 | 0.045 | 0.032 | -0.035 | 0.008 | -0.019 | -.061* | -0.056 | -0.028 | .059* | -0.041 | -0.034 | -0.034 | 0.057 | -.059* | -0.017 |
| 0.001 | 0.000 | 0.000 | 0.000 | 0.000 | 0.000 | 0.001 | 0.057 | 0.000 | 0.000 | 0.789 | 0.000 | 0.580 | 0.769 | 0.133 | 0.290 | 0.247 | 0.799 | 0.532 | 0.040 | 0.060 | 0.352 | 0.047 | 0.166 | 0.249 | 0.249 | 0.058 | 0.050 | 0.569 | ||
| Anxiety Score (3) | -.149** | .802** | 1.000 | .841** | -.158** | -.111** | -.123** | -.074* | -.060* | -.093** | -.111** | 0.007 | -.135** | 0.013 | 0.014 | 0.045 | 0.048 | -0.012 | 0.030 | -0.024 | -.062* | -0.042 | -0.005 | .059* | -0.015 | -0.016 | -.085** | 0.029 | -0.058 | -0.031 |
| 0.000 | 0.000 | 0.000 | 0.000 | 0.000 | 0.000 | 0.014 | 0.044 | 0.002 | 0.000 | 0.826 | 0.000 | 0.669 | 0.643 | 0.134 | 0.109 | 0.679 | 0.317 | 0.428 | 0.039 | 0.163 | 0.874 | 0.048 | 0.617 | 0.589 | 0.005 | 0.338 | 0.051 | 0.294 | ||
| Stress Score (4) | -.140** | .831** | .841** | 1.000 | -.159** | -.121** | -.110** | -.068* | -0.050 | -.101** | -.096** | 0.027 | -.132** | 0.042 | 0.037 | .069* | .071* | -0.033 | 0.011 | -0.032 | -.066* | -0.024 | -0.018 | .072* | -0.030 | -0.020 | -.066* | 0.031 | -0.048 | -0.039 |
| 0.000 | 0.000 | 0.000 | 0.000 | 0.000 | 0.000 | 0.023 | 0.091 | 0.001 | 0.001 | 0.369 | 0.000 | 0.157 | 0.211 | 0.020 | 0.018 | 0.272 | 0.701 | 0.280 | 0.026 | 0.418 | 0.555 | 0.016 | 0.311 | 0.498 | 0.027 | 0.307 | 0.105 | 0.192 | ||
| Systolic Blood Pressure (SBP) (5) | .336** | -.158** | -.158** | -.159** | 1.000 | .641** | .341** | .112** | .132** | .301** | .336** | .091** | .438** | 0.008 | 0.054 | -.085** | -.068* | 0.003 | -.115** | 0.036 | .092** | .079** | .139** | -.211** | .165** | .149** | .071* | 0.033 | .190** | .150** |
| 0.000 | 0.000 | 0.000 | 0.000 | 0.000 | 0.000 | 0.000 | 0.000 | 0.000 | 0.000 | 0.002 | 0.000 | 0.790 | 0.071 | 0.004 | 0.022 | 0.933 | 0.000 | 0.227 | 0.002 | 0.008 | 0.000 | 0.000 | 0.000 | 0.000 | 0.017 | 0.263 | 0.000 | 0.000 | ||
| Diastolic Blood Pressure (DBP) (6) | 0.046 | -.127** | -.111** | -.121** | .641** | 1.000 | .396** | .171** | .183** | .360** | .367** | .093** | .375** | 0.041 | .076* | -0.012 | -0.004 | 0.050 | -0.054 | 0.022 | .115** | .221** | 0.035 | -.220** | .062* | .103** | -0.007 | 0.026 | .081** | 0.051 |
| 0.124 | 0.000 | 0.000 | 0.000 | 0.000 | 0.000 | 0.000 | 0.000 | 0.000 | 0.000 | 0.002 | 0.000 | 0.165 | 0.011 | 0.677 | 0.892 | 0.095 | 0.072 | 0.459 | 0.000 | 0.000 | 0.244 | 0.000 | 0.039 | 0.001 | 0.819 | 0.381 | 0.007 | 0.089 | ||
| Body Weight (kg) (7) | -0.020 | -.135** | -.123** | -.110** | .341** | .396** | 1.000 | .520** | .381** | .842** | .869** | .220** | .810** | .156** | .213** | -0.011 | 0.033 | .122** | -.092** | -0.006 | .287** | .304** | -0.007 | -.197** | 0.020 | .115** | 0.018 | .067* | .093** | .106** |
| 0.499 | 0.000 | 0.000 | 0.000 | 0.000 | 0.000 | 0.000 | 0.000 | 0.000 | 0.000 | 0.000 | 0.000 | 0.000 | 0.000 | 0.709 | 0.271 | 0.000 | 0.002 | 0.853 | 0.000 | 0.000 | 0.807 | 0.000 | 0.512 | 0.000 | 0.548 | 0.026 | 0.002 | 0.000 | ||
| Body Height (cm) (8) | -.236** | -.097** | -.074* | -.068* | .112** | .171** | .520** | 1.000 | .562** | .577** | .073* | -.467** | .175** | -.531** | -.499** | -.571** | -.490** | .711** | .585** | .597** | .705** | .441** | -.088** | -.125** | -0.027 | -0.030 | 0.002 | .080** | .113** | -0.026 |
| 0.000 | 0.001 | 0.014 | 0.023 | 0.000 | 0.000 | 0.000 | 0.000 | 0.000 | 0.014 | 0.000 | 0.000 | 0.000 | 0.000 | 0.000 | 0.000 | 0.000 | 0.000 | 0.000 | 0.000 | 0.000 | 0.003 | 0.000 | 0.362 | 0.314 | 0.944 | 0.007 | 0.000 | 0.380 | ||
| Handgrip (9) | -.173** | -0.057 | -.060* | -0.050 | .132** | .183** | .381** | .562** | 1.000 | .530** | .135** | -.415** | .231** | -.449** | -.421** | -.502** | -.435** | .560** | .476** | .506** | .584** | .384** | -0.039 | -.133** | 0.028 | -0.035 | 0.020 | .130** | .090** | -.073* |
| 0.000 | 0.057 | 0.044 | 0.091 | 0.000 | 0.000 | 0.000 | 0.000 | 0.000 | 0.000 | 0.000 | 0.000 | 0.000 | 0.000 | 0.000 | 0.000 | 0.000 | 0.000 | 0.000 | 0.000 | 0.000 | 0.188 | 0.000 | 0.341 | 0.246 | 0.501 | 0.000 | 0.003 | 0.014 | ||
| Skeletal Muscle Index (SMI) (10) | -.133** | -.115** | -.093** | -.101** | .301** | .360** | .842** | .577** | .530** | 1.000 | .670** | -.164** | .672** | -.211** | -.156** | -.385** | -.284** | .518** | .278** | .317** | .568** | .377** | -0.049 | -.229** | 0.001 | .093** | 0.023 | .101** | .096** | 0.057 |
| 0.000 | 0.000 | 0.002 | 0.001 | 0.000 | 0.000 | 0.000 | 0.000 | 0.000 | 0.000 | 0.000 | 0.000 | 0.000 | 0.000 | 0.000 | 0.000 | 0.000 | 0.000 | 0.000 | 0.000 | 0.000 | 0.101 | 0.000 | 0.983 | 0.002 | 0.440 | 0.001 | 0.001 | 0.057 | ||
| Body Mass Index (BMI, kg/m²) (11) | .105** | -.111** | -.111** | -.096** | .336** | .367** | .869** | .073* | .135** | .670** | 1.000 | .522** | .862** | .481** | .530** | .299** | .324** | -.243** | -.435** | -.336** | -0.046 | .108** | 0.041 | -.167** | 0.035 | .169** | 0.018 | 0.026 | 0.048 | .146** |
| 0.000 | 0.000 | 0.000 | 0.001 | 0.000 | 0.000 | 0.000 | 0.014 | 0.000 | 0.000 | 0.000 | 0.000 | 0.000 | 0.000 | 0.000 | 0.000 | 0.000 | 0.000 | 0.000 | 0.127 | 0.000 | 0.170 | 0.000 | 0.246 | 0.000 | 0.551 | 0.381 | 0.106 | 0.000 | ||
| Total Body Fat, % (12) | .221** | 0.008 | 0.007 | 0.027 | .091** | .093** | .220** | -.467** | -.415** | -.164** | .522** | 1.000 | .341** | .923** | .953** | .867** | .820** | -.852** | -.919** | -.854** | -.733** | -.261** | .109** | .068* | 0.046 | .087** | -0.044 | -.074* | -0.043 | .107** |
| 0.000 | 0.789 | 0.826 | 0.369 | 0.002 | 0.002 | 0.000 | 0.000 | 0.000 | 0.000 | 0.000 | 0.000 | 0.000 | 0.000 | 0.000 | 0.000 | 0.000 | 0.000 | 0.000 | 0.000 | 0.000 | 0.000 | 0.022 | 0.123 | 0.003 | 0.142 | 0.013 | 0.147 | 0.000 | ||
| Visceral Fat, score (13) | .305** | -.122** | -.135** | -.132** | .438** | .375** | .810** | .175** | .231** | .672** | .862** | .341** | 1.000 | .230** | .294** | 0.043 | .059* | -.093** | -.300** | -.114** | .113** | .125** | 0.056 | -.240** | 0.057 | .186** | .076* | 0.057 | .107** | .201** |
| 0.000 | 0.000 | 0.000 | 0.000 | 0.000 | 0.000 | 0.000 | 0.000 | 0.000 | 0.000 | 0.000 | 0.000 | 0.000 | 0.000 | 0.155 | 0.049 | 0.002 | 0.000 | 0.000 | 0.000 | 0.000 | 0.061 | 0.000 | 0.056 | 0.000 | 0.011 | 0.056 | 0.000 | 0.000 | ||
| Total Subcutaneous Fat, % (14) | .126** | 0.017 | 0.013 | 0.042 | 0.008 | 0.041 | .156** | -.531** | -.449** | -.211** | .481** | .923** | .230** | 1.000 | .971** | .907** | .868** | -.850** | -.871** | -.920** | -.755** | -.301** | .085** | .092** | 0.025 | .075* | -.059* | -.104** | -.095** | .061* |
| 0.000 | 0.580 | 0.669 | 0.157 | 0.790 | 0.165 | 0.000 | 0.000 | 0.000 | 0.000 | 0.000 | 0.000 | 0.000 | 0.000 | 0.000 | 0.000 | 0.000 | 0.000 | 0.000 | 0.000 | 0.000 | 0.004 | 0.002 | 0.394 | 0.012 | 0.048 | 0.001 | 0.001 | 0.041 | ||
| Trunk Subcutaneous Fat, % (15) | .152** | 0.009 | 0.014 | 0.037 | 0.054 | .076* | .213** | -.499** | -.421** | -.156** | .530** | .953** | .294** | .971** | 1.000 | .897** | .867** | -.845** | -.888** | -.907** | -.750** | -.272** | .097** | .076* | 0.036 | .087** | -0.054 | -.093** | -.076* | .074* |
| 0.000 | 0.769 | 0.643 | 0.211 | 0.071 | 0.011 | 0.000 | 0.000 | 0.000 | 0.000 | 0.000 | 0.000 | 0.000 | 0.000 | 0.000 | 0.000 | 0.000 | 0.000 | 0.000 | 0.000 | 0.000 | 0.001 | 0.011 | 0.226 | 0.003 | 0.069 | 0.002 | 0.011 | 0.013 | ||
| Arm Subcutaneous Fat, % (16) | 0.044 | 0.045 | 0.045 | .069* | -.085** | -0.012 | -0.011 | -.571** | -.502** | -.385** | .299** | .867** | 0.043 | .907** | .897** | 1.000 | .889** | -.870** | -.831** | -.881** | -.791** | -.295** | .089** | .156** | 0.018 | 0.049 | -.065* | -.108** | -.127** | 0.023 |
| 0.136 | 0.133 | 0.134 | 0.020 | 0.004 | 0.677 | 0.709 | 0.000 | 0.000 | 0.000 | 0.000 | 0.000 | 0.155 | 0.000 | 0.000 | 0.000 | 0.000 | 0.000 | 0.000 | 0.000 | 0.000 | 0.003 | 0.000 | 0.555 | 0.104 | 0.028 | 0.000 | 0.000 | 0.433 | ||
| Leg Subcutaneous Fat,% (17) | 0.008 | 0.032 | 0.048 | .071* | -.068* | -0.004 | 0.033 | -.490** | -.435** | -.284** | .324** | .820** | .059* | .868** | .867** | .889** | 1.000 | -.750** | -.753** | -.846** | -.714** | -.264** | .078** | .128** | 0.028 | 0.057 | -.066* | -.100** | -.121** | 0.019 |
| 0.777 | 0.290 | 0.109 | 0.018 | 0.022 | 0.892 | 0.271 | 0.000 | 0.000 | 0.000 | 0.000 | 0.000 | 0.049 | 0.000 | 0.000 | 0.000 | 0.000 | 0.000 | 0.000 | 0.000 | 0.000 | 0.009 | 0.000 | 0.340 | 0.058 | 0.027 | 0.001 | 0.000 | 0.525 | ||
| Total Skeletal Muscle Mass (18) | -.315** | -0.035 | -0.012 | -0.033 | 0.003 | 0.050 | .122** | .711** | .560** | .518** | -.243** | -.852** | -.093** | -.850** | -.845** | -.870** | -.750** | 1.000 | .906** | .843** | .844** | .392** | -.127** | -.131** | -0.055 | -0.050 | 0.021 | .084** | .070* | -.082** |
| 0.000 | 0.247 | 0.679 | 0.272 | 0.933 | 0.095 | 0.000 | 0.000 | 0.000 | 0.000 | 0.000 | 0.000 | 0.002 | 0.000 | 0.000 | 0.000 | 0.000 | 0.000 | 0.000 | 0.000 | 0.000 | 0.000 | 0.000 | 0.066 | 0.093 | 0.486 | 0.005 | 0.019 | 0.006 | ||
| Trunk Skeletal Muscle Mass (19) | -.376** | 0.008 | 0.030 | 0.011 | -.115** | -0.054 | -.092** | .585** | .476** | .278** | -.435** | -.919** | -.300** | -.871** | -.888** | -.831** | -.753** | .906** | 1.000 | .835** | .736** | .346** | -.149** | -.073* | -.080** | -.096** | 0.013 | .076* | 0.036 | -.128** |
| 0.000 | 0.799 | 0.317 | 0.701 | 0.000 | 0.072 | 0.002 | 0.000 | 0.000 | 0.000 | 0.000 | 0.000 | 0.000 | 0.000 | 0.000 | 0.000 | 0.000 | 0.000 | 0.000 | 0.000 | 0.000 | 0.000 | 0.014 | 0.007 | 0.001 | 0.654 | 0.011 | 0.227 | 0.000 | ||
| Arm Skeletal Muscle Mass, % (20) | -.179** | -0.019 | -0.024 | -0.032 | 0.036 | 0.022 | -0.006 | .597** | .506** | .317** | -.336** | -.854** | -.114** | -.920** | -.907** | -.881** | -.846** | .843** | .835** | 1.000 | .826** | .370** | -.113** | -.130** | -0.047 | -.063* | .059* | .109** | .099** | -0.043 |
| 0.000 | 0.532 | 0.428 | 0.280 | 0.227 | 0.459 | 0.853 | 0.000 | 0.000 | 0.000 | 0.000 | 0.000 | 0.000 | 0.000 | 0.000 | 0.000 | 0.000 | 0.000 | 0.000 | 0.000 | 0.000 | 0.000 | 0.000 | 0.112 | 0.035 | 0.050 | 0.000 | 0.001 | 0.151 | ||
| Leg Skeletal Muscle Mass, % (21) | -.206** | -.061* | -.062* | -.066* | .092** | .115** | .287** | .705** | .584** | .568** | -0.046 | -.733** | .113** | -.755** | -.750** | -.791** | -.714** | .844** | .736** | .826** | 1.000 | .382** | -.108** | -.184** | -0.032 | -0.017 | 0.051 | .115** | .120** | -0.025 |
| 0.000 | 0.040 | 0.039 | 0.026 | 0.002 | 0.000 | 0.000 | 0.000 | 0.000 | 0.000 | 0.127 | 0.000 | 0.000 | 0.000 | 0.000 | 0.000 | 0.000 | 0.000 | 0.000 | 0.000 | 0.000 | 0.000 | 0.000 | 0.289 | 0.574 | 0.085 | 0.000 | 0.000 | 0.399 | ||
| Hemoglobin (Hb), g/dL (22) | -.306** | -0.056 | -0.042 | -0.024 | .079** | .221** | .304** | .441** | .384** | .377** | .108** | -.261** | .125** | -.301** | -.272** | -.295** | -.264** | .392** | .346** | .370** | .382** | 1.000 | -.158** | -.106** | -.074* | -0.022 | 0.058 | .112** | .081** | .111** |
| 0.000 | 0.060 | 0.163 | 0.418 | 0.008 | 0.000 | 0.000 | 0.000 | 0.000 | 0.000 | 0.000 | 0.000 | 0.000 | 0.000 | 0.000 | 0.000 | 0.000 | 0.000 | 0.000 | 0.000 | 0.000 | 0.000 | 0.000 | 0.013 | 0.470 | 0.052 | 0.000 | 0.007 | 0.000 | ||
| Total Cholesterol (TC), mg/dL (23) | .211** | -0.028 | -0.005 | -0.018 | .139** | 0.035 | -0.007 | -.088** | -0.039 | -0.049 | 0.041 | .109** | 0.056 | .085** | .097** | .089** | .078** | -.127** | -.149** | -.113** | -.108** | -.158** | 1.000 | .217** | .663** | .369** | -0.024 | -0.024 | 0.027 | 0.057 |
| 0.000 | 0.352 | 0.874 | 0.555 | 0.000 | 0.244 | 0.807 | 0.003 | 0.188 | 0.101 | 0.170 | 0.000 | 0.061 | 0.004 | 0.001 | 0.003 | 0.009 | 0.000 | 0.000 | 0.000 | 0.000 | 0.000 | 0.000 | 0.000 | 0.000 | 0.428 | 0.419 | 0.357 | 0.057 | ||
| High-Density Lipoprotein Cholesterol (HDL-C), mg/dL (24) | -.141** | .059* | .059* | .072* | -.211** | -.220** | -.197** | -.125** | -.133** | -.229** | -.167** | .068* | -.240** | .092** | .076* | .156** | .128** | -.131** | -.073* | -.130** | -.184** | -.106** | .217** | 1.000 | -.072* | -.250** | -.117** | -.116** | -.115** | -.102** |
| 0.000 | 0.047 | 0.048 | 0.016 | 0.000 | 0.000 | 0.000 | 0.000 | 0.000 | 0.000 | 0.000 | 0.022 | 0.000 | 0.002 | 0.011 | 0.000 | 0.000 | 0.000 | 0.014 | 0.000 | 0.000 | 0.000 | 0.000 | 0.016 | 0.000 | 0.000 | 0.000 | 0.000 | 0.001 | ||
| Low-Density Lipoprotein Cholesterol (LDL-C) (25) | .208** | -0.041 | -0.015 | -0.030 | .165** | .062* | 0.020 | -0.027 | 0.028 | 0.001 | 0.035 | 0.046 | 0.057 | 0.025 | 0.036 | 0.018 | 0.028 | -0.055 | -.080** | -0.047 | -0.032 | -.074* | .663** | -.072* | 1.000 | 0.053 | 0.023 | 0.047 | .097** | 0.006 |
| 0.000 | 0.166 | 0.617 | 0.311 | 0.000 | 0.039 | 0.512 | 0.362 | 0.341 | 0.983 | 0.246 | 0.123 | 0.056 | 0.394 | 0.226 | 0.555 | 0.340 | 0.066 | 0.007 | 0.112 | 0.289 | 0.013 | 0.000 | 0.016 | 0.077 | 0.448 | 0.114 | 0.001 | 0.849 | ||
| Triglycerides (TG) (26) | .115** | -0.034 | -0.016 | -0.020 | .149** | .103** | .115** | -0.030 | -0.035 | .093** | .169** | .087** | .186** | .075* | .087** | 0.049 | 0.057 | -0.050 | -.096** | -.063* | -0.017 | -0.022 | .369** | -.250** | 0.053 | 1.000 | 0.047 | -0.002 | -0.044 | .191** |
| 0.000 | 0.249 | 0.589 | 0.498 | 0.000 | 0.001 | 0.000 | 0.314 | 0.246 | 0.002 | 0.000 | 0.003 | 0.000 | 0.012 | 0.003 | 0.104 | 0.058 | 0.093 | 0.001 | 0.035 | 0.574 | 0.470 | 0.000 | 0.000 | 0.077 | 0.112 | 0.953 | 0.141 | 0.000 | ||
| Aspartate Aminotransferase (AST / SGOT) (27) | .125** | -0.034 | -.085** | -.066* | .071* | -0.007 | 0.018 | 0.002 | 0.020 | 0.023 | 0.018 | -0.044 | .076* | -.059* | -0.054 | -.065* | -.066* | 0.021 | 0.013 | .059* | 0.051 | 0.058 | -0.024 | -.117** | 0.023 | 0.047 | 1.000 | .339** | .088** | 0.022 |
| 0.000 | 0.249 | 0.005 | 0.027 | 0.017 | 0.819 | 0.548 | 0.944 | 0.501 | 0.440 | 0.551 | 0.142 | 0.011 | 0.048 | 0.069 | 0.028 | 0.027 | 0.486 | 0.654 | 0.050 | 0.085 | 0.052 | 0.428 | 0.000 | 0.448 | 0.112 | 0.000 | 0.003 | 0.470 | ||
| Alanine Aminotransferase (ALT / SGPT) (28) | 0.055 | 0.057 | 0.029 | 0.031 | 0.033 | 0.026 | .067* | .080** | .130** | .101** | 0.026 | -.074* | 0.057 | -.104** | -.093** | -.108** | -.100** | .084** | .076* | .109** | .115** | .112** | -0.024 | -.116** | 0.047 | -0.002 | .339** | 1.000 | .076* | -0.017 |
| 0.068 | 0.058 | 0.338 | 0.307 | 0.263 | 0.381 | 0.026 | 0.007 | 0.000 | 0.001 | 0.381 | 0.013 | 0.056 | 0.001 | 0.002 | 0.000 | 0.001 | 0.005 | 0.011 | 0.000 | 0.000 | 0.000 | 0.419 | 0.000 | 0.114 | 0.953 | 0.000 | 0.011 | 0.575 | ||
| Serum Creatinine (Cr) (29) | .197** | -.059* | -0.058 | -0.048 | .190** | .081** | .093** | .113** | .090** | .096** | 0.048 | -0.043 | .107** | -.095** | -.076* | -.127** | -.121** | .070* | 0.036 | .099** | .120** | .081** | 0.027 | -.115** | .097** | -0.044 | .088** | .076* | 1.000 | .072* |
| 0.000 | 0.050 | 0.051 | 0.105 | 0.000 | 0.007 | 0.002 | 0.000 | 0.003 | 0.001 | 0.106 | 0.147 | 0.000 | 0.001 | 0.011 | 0.000 | 0.000 | 0.019 | 0.227 | 0.001 | 0.000 | 0.007 | 0.357 | 0.000 | 0.001 | 0.141 | 0.003 | 0.011 | 0.016 | ||
| Fasting Blood Glucose (30) | .192** | -0.017 | -0.031 | -0.039 | .150** | 0.051 | .106** | -0.026 | -.073* | 0.057 | .146** | .107** | .201** | .061* | .074* | 0.023 | 0.019 | -.082** | -.128** | -0.043 | -0.025 | .111** | 0.057 | -.102** | 0.006 | .191** | 0.022 | -0.017 | .072* | 1.000 |
| 0.000 | 0.569 | 0.294 | 0.192 | 0.000 | 0.089 | 0.000 | 0.380 | 0.014 | 0.057 | 0.000 | 0.000 | 0.000 | 0.041 | 0.013 | 0.433 | 0.525 | 0.006 | 0.000 | 0.151 | 0.399 | 0.000 | 0.057 | 0.001 | 0.849 | 0.000 | 0.470 | 0.575 | 0.016 |
*. Correlation is significant at the 0.05 level (2-tailed).
The partial correlation analysis, controlling for age as indicated in Table 3, elucidated correlations irrespective of chronological aging. Upon controlling for age, several connections diminished, but others persisted as statistically significant, suggesting that specific associations between psychological distress and cardiometabolic or body composition characteristics were not exclusively influenced by age. This indicates that, in addition to biological aging, lifestyle factors, urban stressors, and physiological regulation may influence these relationships independently. (Table 3) The continuity and variation of these associations after age adjustment provide a crucial empirical foundation for the next PLS-SEM analysis, which aims to elucidate the direct, indirect, and mediated processes that underpin these intricate interactions (Fig. 1, Table 4).
| Control | Variable | 2 | 3 | 4 | 5 | 6 | 7 | 8 | 9 | 10 | 11 | 12 | 13 | 14 | 15 | 16 | 17 | 18 | 19 | 20 | 21 | 22 | 23 | 24 | 25 | 26 | 27 | 28 | 29 | 30 |
|---|---|---|---|---|---|---|---|---|---|---|---|---|---|---|---|---|---|---|---|---|---|---|---|---|---|---|---|---|---|---|
| Age, years (1) | Depression Score (2) | 1.000 | 0.799 | 0.813 | -0.132 | -0.109 | -0.126 | -0.115 | -0.079 | -0.093 | -0.076 | 0.009 | -0.089 | 0.024 | 0.012 | 0.034 | 0.025 | -0.030 | 0.000 | -0.032 | -0.083 | -0.078 | -0.012 | 0.046 | -0.032 | -0.001 | -0.019 | 0.053 | -0.034 | -0.006 |
| 0.000 | 0.000 | 0.000 | 0.000 | 0.000 | 0.000 | 0.008 | 0.002 | 0.011 | 0.767 | 0.003 | 0.421 | 0.679 | 0.250 | 0.398 | 0.316 | 0.989 | 0.286 | 0.005 | 0.009 | 0.678 | 0.122 | 0.285 | 0.969 | 0.528 | 0.075 | 0.253 | 0.845 | |||
| Anxiety Score (3) | 0.799 | 1.000 | 0.834 | -0.117 | -0.102 | -0.122 | -0.110 | -0.087 | -0.087 | -0.073 | 0.027 | -0.083 | 0.034 | 0.038 | 0.052 | 0.053 | -0.018 | 0.015 | -0.055 | -0.102 | -0.081 | 0.020 | 0.059 | -0.007 | 0.011 | -0.044 | 0.026 | -0.042 | -0.020 | |
| 0.000 | 0.000 | 0.000 | 0.001 | 0.000 | 0.000 | 0.004 | 0.004 | 0.014 | 0.373 | 0.005 | 0.252 | 0.203 | 0.084 | 0.074 | 0.549 | 0.613 | 0.068 | 0.001 | 0.007 | 0.501 | 0.048 | 0.804 | 0.717 | 0.137 | 0.378 | 0.163 | 0.509 | |||
| Stress Score (4) | 0.813 | 0.834 | 1.000 | -0.122 | -0.108 | -0.107 | -0.103 | -0.074 | -0.101 | -0.060 | 0.050 | -0.086 | 0.058 | 0.059 | 0.076 | 0.076 | -0.060 | -0.021 | -0.062 | -0.104 | -0.064 | 0.012 | 0.070 | -0.015 | -0.011 | -0.049 | 0.027 | -0.039 | -0.017 | |
| 0.000 | 0.000 | 0.000 | 0.000 | 0.000 | 0.001 | 0.013 | 0.001 | 0.045 | 0.093 | 0.004 | 0.050 | 0.050 | 0.011 | 0.011 | 0.043 | 0.475 | 0.038 | 0.001 | 0.031 | 0.681 | 0.020 | 0.618 | 0.702 | 0.099 | 0.370 | 0.195 | 0.570 | |||
| Systolic Blood Pressure (SBP) (5) | -0.132 | -0.117 | -0.122 | 1.000 | 0.690 | 0.364 | 0.178 | 0.183 | 0.354 | 0.320 | 0.055 | 0.368 | 0.019 | 0.052 | -0.093 | -0.029 | 0.078 | -0.029 | 0.060 | 0.152 | 0.181 | 0.087 | -0.195 | 0.115 | 0.109 | 0.028 | 0.009 | 0.107 | 0.071 | |
| 0.000 | 0.000 | 0.000 | 0.000 | 0.000 | 0.000 | 0.000 | 0.000 | 0.000 | 0.064 | 0.000 | 0.526 | 0.084 | 0.002 | 0.325 | 0.009 | 0.324 | 0.043 | 0.000 | 0.000 | 0.004 | 0.000 | 0.000 | 0.000 | 0.353 | 0.771 | 0.000 | 0.017 | |||
| Diastolic Blood Pressure (DBP) (6) | -0.109 | -0.102 | -0.108 | 0.690 | 1.000 | 0.399 | 0.172 | 0.142 | 0.364 | 0.367 | 0.117 | 0.379 | 0.072 | 0.107 | -0.025 | 0.019 | 0.027 | -0.091 | 0.005 | 0.129 | 0.213 | 0.038 | -0.235 | 0.044 | 0.111 | -0.008 | 0.005 | 0.057 | 0.026 | |
| 0.000 | 0.001 | 0.000 | 0.000 | 0.000 | 0.000 | 0.000 | 0.000 | 0.000 | 0.000 | 0.000 | 0.015 | 0.000 | 0.403 | 0.521 | 0.363 | 0.002 | 0.875 | 0.000 | 0.000 | 0.203 | 0.000 | 0.137 | 0.000 | 0.790 | 0.867 | 0.058 | 0.384 | |||
| Body Weight (kg) (7) | -0.126 | -0.122 | -0.107 | 0.364 | 0.399 | 1.000 | 0.518 | 0.326 | 0.832 | 0.858 | 0.281 | 0.854 | 0.208 | 0.271 | -0.060 | 0.044 | 0.060 | -0.156 | -0.012 | 0.269 | 0.305 | -0.006 | -0.211 | 0.020 | 0.116 | 0.083 | 0.137 | 0.074 | 0.077 | |
| 0.000 | 0.000 | 0.000 | 0.000 | 0.000 | 0.000 | 0.000 | 0.000 | 0.000 | 0.000 | 0.000 | 0.000 | 0.000 | 0.045 | 0.141 | 0.045 | 0.000 | 0.680 | 0.000 | 0.000 | 0.829 | 0.000 | 0.501 | 0.000 | 0.005 | 0.000 | 0.013 | 0.010 | |||
| Body Height (cm) (8) | -0.115 | -0.110 | -0.103 | 0.178 | 0.172 | 0.518 | 1.000 | 0.476 | 0.492 | 0.022 | -0.400 | 0.234 | -0.480 | -0.443 | -0.579 | -0.478 | 0.618 | 0.485 | 0.559 | 0.644 | 0.380 | -0.055 | -0.168 | 0.019 | -0.013 | 0.049 | 0.121 | 0.123 | -0.008 | |
| 0.000 | 0.000 | 0.001 | 0.000 | 0.000 | 0.000 | 0.000 | 0.000 | 0.454 | 0.000 | 0.000 | 0.000 | 0.000 | 0.000 | 0.000 | 0.000 | 0.000 | 0.000 | 0.000 | 0.000 | 0.067 | 0.000 | 0.529 | 0.665 | 0.103 | 0.000 | 0.000 | 0.786 | |||
| Handgrip (9) | -0.079 | -0.087 | -0.074 | 0.183 | 0.142 | 0.326 | 0.476 | 1.000 | 0.429 | 0.105 | -0.327 | 0.214 | -0.377 | -0.339 | -0.458 | -0.392 | 0.440 | 0.359 | 0.433 | 0.498 | 0.330 | -0.004 | -0.104 | 0.038 | -0.002 | 0.063 | 0.175 | 0.082 | -0.055 | |
| 0.008 | 0.004 | 0.013 | 0.000 | 0.000 | 0.000 | 0.000 | 0.000 | 0.000 | 0.000 | 0.000 | 0.000 | 0.000 | 0.000 | 0.000 | 0.000 | 0.000 | 0.000 | 0.000 | 0.000 | 0.899 | 0.000 | 0.200 | 0.948 | 0.035 | 0.000 | 0.006 | 0.066 | |||
| Skeletal Muscle Index (SMI) (10) | -0.093 | -0.087 | -0.101 | 0.354 | 0.364 | 0.832 | 0.492 | 0.429 | 1.000 | 0.696 | -0.079 | 0.723 | -0.117 | -0.074 | -0.398 | -0.238 | 0.482 | 0.186 | 0.261 | 0.491 | 0.326 | -0.025 | -0.256 | 0.032 | 0.109 | 0.085 | 0.163 | 0.116 | 0.083 | |
| 0.002 | 0.004 | 0.001 | 0.000 | 0.000 | 0.000 | 0.000 | 0.000 | 0.000 | 0.008 | 0.000 | 0.000 | 0.013 | 0.000 | 0.000 | 0.000 | 0.000 | 0.000 | 0.000 | 0.000 | 0.410 | 0.000 | 0.286 | 0.000 | 0.004 | 0.000 | 0.000 | 0.005 | |||
| Body Mass Index (BMI, kg/m²) (11) | -0.076 | -0.073 | -0.060 | 0.320 | 0.367 | 0.858 | 0.022 | 0.105 | 0.696 | 1.000 | 0.548 | 0.858 | 0.521 | 0.571 | 0.259 | 0.319 | -0.273 | -0.446 | -0.340 | -0.041 | 0.130 | 0.024 | -0.158 | 0.017 | 0.140 | 0.068 | 0.098 | 0.017 | 0.095 | |
| 0.011 | 0.014 | 0.045 | 0.000 | 0.000 | 0.000 | 0.454 | 0.000 | 0.000 | 0.000 | 0.000 | 0.000 | 0.000 | 0.000 | 0.000 | 0.000 | 0.000 | 0.000 | 0.172 | 0.000 | 0.419 | 0.000 | 0.567 | 0.000 | 0.023 | 0.001 | 0.567 | 0.001 | |||
| Total Body Fat, % (12) | 0.009 | 0.027 | 0.050 | 0.055 | 0.117 | 0.281 | -0.400 | -0.327 | -0.079 | 0.548 | 1.000 | 0.341 | 0.905 | 0.930 | 0.841 | 0.812 | -0.793 | -0.867 | -0.816 | -0.679 | -0.172 | 0.077 | 0.079 | -0.003 | 0.077 | -0.036 | -0.074 | -0.106 | 0.049 | |
| 0.767 | 0.373 | 0.093 | 0.064 | 0.000 | 0.000 | 0.000 | 0.000 | 0.008 | 0.000 | 0.000 | 0.000 | 0.000 | 0.000 | 0.000 | 0.000 | 0.000 | 0.000 | 0.000 | 0.000 | 0.009 | 0.008 | 0.913 | 0.009 | 0.234 | 0.013 | 0.000 | 0.100 | |||
| Visceral Fat, score (13) | -0.089 | -0.083 | -0.086 | 0.368 | 0.379 | 0.854 | 0.234 | 0.214 | 0.723 | 0.858 | 0.341 | 1.000 | 0.273 | 0.335 | -0.010 | 0.067 | -0.059 | -0.246 | -0.084 | 0.178 | 0.225 | -0.004 | -0.206 | -0.001 | 0.149 | 0.111 | 0.132 | 0.038 | 0.108 | |
| 0.003 | 0.005 | 0.004 | 0.000 | 0.000 | 0.000 | 0.000 | 0.000 | 0.000 | 0.000 | 0.000 | 0.000 | 0.000 | 0.736 | 0.025 | 0.048 | 0.000 | 0.005 | 0.000 | 0.000 | 0.890 | 0.000 | 0.982 | 0.000 | 0.000 | 0.000 | 0.205 | 0.000 | |||
| Total Subcutaneous Fat, % (14) | 0.024 | 0.034 | 0.058 | 0.019 | 0.072 | 0.208 | -0.480 | -0.377 | -0.117 | 0.521 | 0.905 | 0.273 | 1.000 | 0.956 | 0.873 | 0.836 | -0.779 | -0.808 | -0.906 | -0.725 | -0.240 | 0.077 | 0.091 | -0.003 | 0.072 | -0.043 | -0.096 | -0.127 | 0.035 | |
| 0.421 | 0.252 | 0.050 | 0.526 | 0.015 | 0.000 | 0.000 | 0.000 | 0.000 | 0.000 | 0.000 | 0.000 | 0.000 | 0.000 | 0.000 | 0.000 | 0.000 | 0.000 | 0.000 | 0.000 | 0.010 | 0.002 | 0.929 | 0.016 | 0.152 | 0.001 | 0.000 | 0.244 | |||
| Trunk Subcutaneous Fat, % (15) | 0.012 | 0.038 | 0.059 | 0.052 | 0.107 | 0.271 | -0.443 | -0.339 | -0.074 | 0.571 | 0.930 | 0.335 | 0.956 | 1.000 | 0.862 | 0.830 | -0.782 | -0.830 | -0.886 | -0.702 | -0.203 | 0.080 | 0.078 | 0.000 | 0.080 | -0.037 | -0.080 | -0.115 | 0.039 | |
| 0.679 | 0.203 | 0.050 | 0.084 | 0.000 | 0.000 | 0.000 | 0.000 | 0.013 | 0.000 | 0.000 | 0.000 | 0.000 | 0.000 | 0.000 | 0.000 | 0.000 | 0.000 | 0.000 | 0.000 | 0.008 | 0.009 | 0.988 | 0.007 | 0.222 | 0.007 | 0.000 | 0.193 | |||
| Arm Subcutaneous Fat, % (16) | 0.034 | 0.052 | 0.076 | -0.093 | -0.025 | -0.060 | -0.579 | -0.458 | -0.398 | 0.259 | 0.841 | -0.010 | 0.873 | 0.862 | 1.000 | 0.879 | -0.863 | -0.806 | -0.879 | -0.797 | -0.307 | 0.102 | 0.169 | 0.005 | 0.044 | -0.057 | -0.125 | -0.156 | 0.004 | |
| 0.250 | 0.084 | 0.011 | 0.002 | 0.403 | 0.045 | 0.000 | 0.000 | 0.000 | 0.000 | 0.000 | 0.736 | 0.000 | 0.000 | 0.000 | 0.000 | 0.000 | 0.000 | 0.000 | 0.000 | 0.001 | 0.000 | 0.878 | 0.140 | 0.057 | 0.000 | 0.000 | 0.906 | |||
| Leg Subcutaneous Fat,% (17) | 0.025 | 0.053 | 0.076 | -0.029 | 0.019 | 0.044 | -0.478 | -0.392 | -0.238 | 0.319 | 0.812 | 0.067 | 0.836 | 0.830 | 0.879 | 1.000 | -0.731 | -0.745 | -0.829 | -0.730 | -0.254 | 0.095 | 0.116 | 0.027 | 0.055 | -0.049 | -0.102 | -0.133 | 0.020 | |
| 0.398 | 0.074 | 0.011 | 0.325 | 0.521 | 0.141 | 0.000 | 0.000 | 0.000 | 0.000 | 0.000 | 0.025 | 0.000 | 0.000 | 0.000 | 0.000 | 0.000 | 0.000 | 0.000 | 0.000 | 0.001 | 0.000 | 0.365 | 0.065 | 0.103 | 0.001 | 0.000 | 0.513 | |||
| Total Skeletal Muscle Mass (18) | -0.030 | -0.018 | -0.060 | 0.078 | 0.027 | 0.060 | 0.618 | 0.440 | 0.482 | -0.273 | -0.793 | -0.059 | -0.779 | -0.782 | -0.863 | -0.731 | 1.000 | 0.831 | 0.748 | 0.725 | 0.264 | -0.070 | -0.153 | 0.013 | -0.029 | 0.035 | 0.113 | 0.138 | -0.006 | |
| 0.316 | 0.549 | 0.043 | 0.009 | 0.363 | 0.045 | 0.000 | 0.000 | 0.000 | 0.000 | 0.000 | 0.048 | 0.000 | 0.000 | 0.000 | 0.000 | 0.000 | 0.000 | 0.000 | 0.000 | 0.019 | 0.000 | 0.669 | 0.332 | 0.236 | 0.000 | 0.000 | 0.852 | |||
| Trunk Skeletal Muscle Mass (19) | 0.000 | 0.015 | -0.021 | -0.029 | -0.091 | -0.156 | 0.485 | 0.359 | 0.186 | -0.446 | -0.867 | -0.246 | -0.808 | -0.830 | -0.806 | -0.745 | 0.831 | 1.000 | 0.748 | 0.605 | 0.195 | -0.081 | -0.085 | -0.005 | -0.075 | 0.036 | 0.084 | 0.116 | -0.053 | |
| 0.989 | 0.613 | 0.475 | 0.324 | 0.002 | 0.000 | 0.000 | 0.000 | 0.000 | 0.000 | 0.000 | 0.000 | 0.000 | 0.000 | 0.000 | 0.000 | 0.000 | 0.000 | 0.000 | 0.000 | 0.006 | 0.005 | 0.860 | 0.012 | 0.222 | 0.005 | 0.000 | 0.079 | |||
| Age, years (1) | Arm Skeletal Muscle Mass, % (20) | -0.032 | -0.055 | -0.062 | 0.060 | 0.005 | -0.012 | 0.559 | 0.433 | 0.261 | -0.340 | -0.816 | -0.084 | -0.906 | -0.886 | -0.879 | -0.829 | 0.748 | 0.748 | 1.000 | 0.788 | 0.308 | -0.094 | -0.150 | -0.011 | -0.043 | 0.055 | 0.121 | 0.132 | -0.011 |
| 0.286 | 0.068 | 0.038 | 0.043 | 0.875 | 0.680 | 0.000 | 0.000 | 0.000 | 0.000 | 0.000 | 0.005 | 0.000 | 0.000 | 0.000 | 0.000 | 0.000 | 0.000 | 0.000 | 0.000 | 0.002 | 0.000 | 0.717 | 0.148 | 0.063 | 0.000 | 0.000 | 0.723 | |||
| Leg Skeletal Muscle Mass, % (21) | -0.083 | -0.102 | -0.104 | 0.152 | 0.129 | 0.269 | 0.644 | 0.498 | 0.491 | -0.041 | -0.679 | 0.178 | -0.725 | -0.702 | -0.797 | -0.730 | 0.725 | 0.605 | 0.788 | 1.000 | 0.330 | -0.077 | -0.200 | 0.016 | -0.007 | 0.086 | 0.162 | 0.155 | 0.028 | |
| 0.005 | 0.001 | 0.001 | 0.000 | 0.000 | 0.000 | 0.000 | 0.000 | 0.000 | 0.172 | 0.000 | 0.000 | 0.000 | 0.000 | 0.000 | 0.000 | 0.000 | 0.000 | 0.000 | 0.000 | 0.009 | 0.000 | 0.594 | 0.827 | 0.004 | 0.000 | 0.000 | 0.353 | |||
| Hemoglobin (Hb), g/dL (22) | -0.078 | -0.081 | -0.064 | 0.181 | 0.213 | 0.305 | 0.380 | 0.330 | 0.326 | 0.130 | -0.172 | 0.225 | -0.240 | -0.203 | -0.307 | -0.254 | 0.264 | 0.195 | 0.308 | 0.330 | 1.000 | -0.086 | -0.170 | -0.013 | -0.016 | 0.114 | 0.133 | 0.081 | 0.142 | |
| 0.009 | 0.007 | 0.031 | 0.000 | 0.000 | 0.000 | 0.000 | 0.000 | 0.000 | 0.000 | 0.000 | 0.000 | 0.000 | 0.000 | 0.000 | 0.000 | 0.000 | 0.000 | 0.000 | 0.000 | 0.004 | 0.000 | 0.667 | 0.589 | 0.000 | 0.000 | 0.007 | 0.000 | |||
| Total Cholesterol (TC), mg/dL (23) | -0.012 | 0.020 | 0.012 | 0.087 | 0.038 | -0.006 | -0.055 | -0.004 | -0.025 | 0.024 | 0.077 | -0.004 | 0.077 | 0.080 | 0.102 | 0.095 | -0.070 | -0.081 | -0.094 | -0.077 | -0.086 | 1.000 | 0.266 | 0.701 | 0.316 | -0.060 | -0.033 | -0.012 | 0.009 | |
| 0.678 | 0.501 | 0.681 | 0.004 | 0.203 | 0.829 | 0.067 | 0.899 | 0.410 | 0.419 | 0.009 | 0.890 | 0.010 | 0.008 | 0.001 | 0.001 | 0.019 | 0.006 | 0.002 | 0.009 | 0.004 | 0.000 | 0.000 | 0.000 | 0.045 | 0.273 | 0.681 | 0.752 | |||
| High-Density Lipoprotein Cholesterol (HDL-C), mg/dL (24) | 0.046 | 0.059 | 0.070 | -0.195 | -0.235 | -0.211 | -0.168 | -0.104 | -0.256 | -0.158 | 0.079 | -0.206 | 0.091 | 0.078 | 0.169 | 0.116 | -0.153 | -0.085 | -0.150 | -0.200 | -0.170 | 0.266 | 1.000 | -0.075 | -0.241 | -0.125 | -0.111 | -0.102 | -0.104 | |
| 0.122 | 0.048 | 0.020 | 0.000 | 0.000 | 0.000 | 0.000 | 0.000 | 0.000 | 0.000 | 0.008 | 0.000 | 0.002 | 0.009 | 0.000 | 0.000 | 0.000 | 0.005 | 0.000 | 0.000 | 0.000 | 0.000 | 0.013 | 0.000 | 0.000 | 0.000 | 0.001 | 0.000 | |||
| Low-Density Lipoprotein Cholesterol (LDL-C) (25) | -0.032 | -0.007 | -0.015 | 0.115 | 0.044 | 0.020 | 0.019 | 0.038 | 0.032 | 0.017 | -0.003 | -0.001 | -0.003 | 0.000 | 0.005 | 0.027 | 0.013 | -0.005 | -0.011 | 0.016 | -0.013 | 0.701 | -0.075 | 1.000 | 0.022 | 0.006 | 0.062 | 0.068 | -0.042 | |
| 0.285 | 0.804 | 0.618 | 0.000 | 0.137 | 0.501 | 0.529 | 0.200 | 0.286 | 0.567 | 0.913 | 0.982 | 0.929 | 0.988 | 0.878 | 0.365 | 0.669 | 0.860 | 0.717 | 0.594 | 0.667 | 0.000 | 0.013 | 0.468 | 0.852 | 0.039 | 0.023 | 0.164 | |||
| Triglycerides (TG) (26) | -0.001 | 0.011 | -0.011 | 0.109 | 0.111 | 0.116 | -0.013 | -0.002 | 0.109 | 0.140 | 0.077 | 0.149 | 0.072 | 0.080 | 0.044 | 0.055 | -0.029 | -0.075 | -0.043 | -0.007 | -0.016 | 0.316 | -0.241 | 0.022 | 1.000 | 0.034 | -0.008 | -0.064 | 0.201 | |
| 0.969 | 0.717 | 0.702 | 0.000 | 0.000 | 0.000 | 0.665 | 0.948 | 0.000 | 0.000 | 0.009 | 0.000 | 0.016 | 0.007 | 0.140 | 0.065 | 0.332 | 0.012 | 0.148 | 0.827 | 0.589 | 0.000 | 0.000 | 0.468 | 0.255 | 0.784 | 0.032 | 0.000 | |||
| Aspartate Aminotransferase (AST / SGOT) (27) | -0.019 | -0.044 | -0.049 | 0.028 | -0.008 | 0.083 | 0.049 | 0.063 | 0.085 | 0.068 | -0.036 | 0.111 | -0.043 | -0.037 | -0.057 | -0.049 | 0.035 | 0.036 | 0.055 | 0.086 | 0.114 | -0.060 | -0.125 | 0.006 | 0.034 | 1.000 | 0.471 | 0.035 | 0.035 | |
| 0.528 | 0.137 | 0.099 | 0.353 | 0.790 | 0.005 | 0.103 | 0.035 | 0.004 | 0.023 | 0.234 | 0.000 | 0.152 | 0.222 | 0.057 | 0.103 | 0.236 | 0.222 | 0.063 | 0.004 | 0.000 | 0.045 | 0.000 | 0.852 | 0.255 | 0.000 | 0.239 | 0.238 | |||
| Alanine Aminotransferase (ALT / SGPT) (28) | 0.053 | 0.026 | 0.027 | 0.009 | 0.005 | 0.137 | 0.121 | 0.175 | 0.163 | 0.098 | -0.074 | 0.132 | -0.096 | -0.080 | -0.125 | -0.102 | 0.113 | 0.084 | 0.121 | 0.162 | 0.133 | -0.033 | -0.111 | 0.062 | -0.008 | 0.471 | 1.000 | 0.045 | -0.003 | |
| 0.075 | 0.378 | 0.370 | 0.771 | 0.867 | 0.000 | 0.000 | 0.000 | 0.000 | 0.001 | 0.013 | 0.000 | 0.001 | 0.007 | 0.000 | 0.001 | 0.000 | 0.005 | 0.000 | 0.000 | 0.000 | 0.273 | 0.000 | 0.039 | 0.784 | 0.000 | 0.131 | 0.916 | |||
| Serum Creatinine (Cr) (29) | -0.034 | -0.042 | -0.039 | 0.107 | 0.057 | 0.074 | 0.123 | 0.082 | 0.116 | 0.017 | -0.106 | 0.038 | -0.127 | -0.115 | -0.156 | -0.133 | 0.138 | 0.116 | 0.132 | 0.155 | 0.081 | -0.012 | -0.102 | 0.068 | -0.064 | 0.035 | 0.045 | 1.000 | 0.001 | |
| 0.253 | 0.163 | 0.195 | 0.000 | 0.058 | 0.013 | 0.000 | 0.006 | 0.000 | 0.567 | 0.000 | 0.205 | 0.000 | 0.000 | 0.000 | 0.000 | 0.000 | 0.000 | 0.000 | 0.000 | 0.007 | 0.681 | 0.001 | 0.023 | 0.032 | 0.239 | 0.131 | 0.985 | |||
| Fasting Blood Glucose (30) | -0.006 | -0.020 | -0.017 | 0.071 | 0.026 | 0.077 | -0.008 | -0.055 | 0.083 | 0.095 | 0.049 | 0.108 | 0.035 | 0.039 | 0.004 | 0.020 | -0.006 | -0.053 | -0.011 | 0.028 | 0.142 | 0.009 | -0.104 | -0.042 | 0.201 | 0.035 | -0.003 | 0.001 | 1.000 | |
| 0.845 | 0.509 | 0.570 | 0.017 | 0.384 | 0.010 | 0.786 | 0.066 | 0.005 | 0.001 | 0.100 | 0.000 | 0.244 | 0.193 | 0.906 | 0.513 | 0.852 | 0.079 | 0.723 | 0.353 | 0.000 | 0.752 | 0.000 | 0.164 | 0.000 | 0.238 | 0.916 | 0.985 |
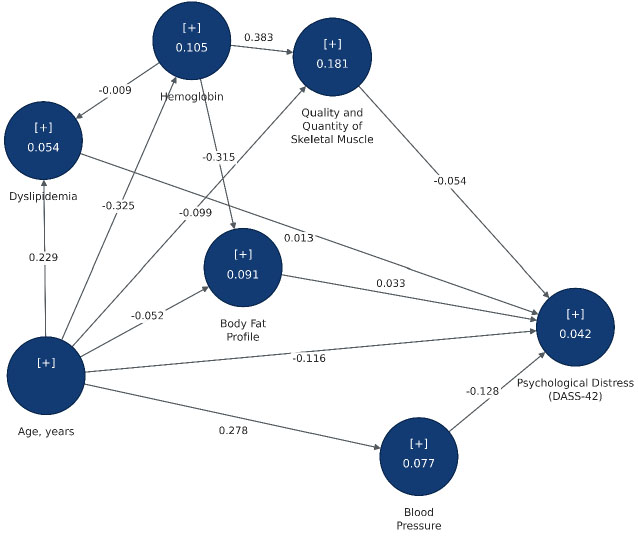
The PLS-SEM results (n = 1,123; age range 18-98 years; urban population) portray a notable change in physiological and psychological stress patterns towards younger demographics. These tendencies are observable in an urban context where stress-related effects do not adhere to a strictly biological aging gradient but manifest earlier throughout adulthood (Fig. 1, Table 4).
| Path Variable | A | B | C | D | E | F | G |
|---|---|---|---|---|---|---|---|
| Ages, years (A) | - | 0.278 | 0.229 | -0.052 | -0.325 | -0.116 | -0.099 |
| Blood Pressure (B) | - | - | - | - | - | -0.128 | - |
| Dyslipidemia (C) | - | - | - | - | - | 0.013 | - |
| Body Fat Profile (D) | - | - | - | - | - | 0.033 | - |
| Hemoglobin (E) | - | - | -0.009 | -0.315 | - | - | 0.383 |
| Psychology Distress (DASS-42) (F) | - | - | - | - | - | - | - |
| Quality and Quantity Skeletal Muscle (G) | - | - | - | - | - | -0.054 | - |
Age exhibited a positive correlation with blood pressure (β = 0.278; R2 = 0.077), signifying that blood pressure escalated with increasing age at the population level; however, the variance accounted for by age alone was small. The relationship between age and psychological distress was inversely correlated and of modest strength (β = −0.116; R2 = 0.042), indicating that younger participants experienced greater levels of distress. This pattern was additionally evident in the inverse correlation between blood pressure and psychological distress (β = −0.128), suggesting that these two variables exhibited distinct gradients within the model (Fig. 1, Table 4).
Standard metabolic markers had negligible impacts on psychological distress, shown by the low path coefficients of dyslipidemia (β = 0.013; R2 = 0.054) and body fat profiles (β = 0.033; R2 = 0.091). Skeletal muscle status had a modest explained variance (R2 = 0.181) and showed a robust correlation with hemoglobin levels (β = 0.383), although its direct relationship with psychological distress was weak and negative (β = −0.054) (Fig. 1, Table 4).
4. DISCUSSION
The findings of the PLS-SEM model from this study indicate a significant trend in urban health epidemiology where the burden of increased blood pressure and psychological distress are important health concern among younger, working-age adults. These findings align with global trends demonstrating an emergence of hypertension in young adult populations within urban environments, especially in low- and middle-income nations with rapid urbanization [21, 22]. Research in urban areas of Bihar and Gujarat, India, found the prevalence of stage 1 hypertension at 17.9% and prehypertension at 51.6% among individuals aged 20-40 years. These findings confirm that elevated blood pressure is an increasingly significant health concern among urban young adults, not solely a geriatric issue [23].
The relationship between age and blood pressure had a positive coefficient (β = 0.278) but a poor coefficient of determination (R2 = 0.077). From a traditional standpoint, this may be construed as indicative of inadequate predictive capability. Nevertheless, in the realm of intricate social processes, models with low R2 values can still demonstrate good validity. According to the methodological literature, models with low R2 values can still demonstrate good validity when the dependent variable is affected by numerous external factors that are not entirely represented in the structural model [24, 25]. In urban cardiovascular health, Cuevas and Williams (2017) highlighted that psychosocial factors triggering emotional stress function via the activation of the sympathetic nervous system and the hypothalamic-pituitary-adrenal (HPA) axis, resulting in intricate pathways that conventional demographic predictors cannot adequately elucidate [26].
The discovery that chronological age explains merely 7.7% of the variance in blood pressure suggests that the remaining 92.3% is attributable to other factors. The remaining unexplained variance may reflect the contribution of other determinants of blood pressure, including behavioral, psychosocial, socioeconomic, environmental, and clinical factors that were not incorporated into the present model. A prospective analysis from the National Longitudinal Study of Adolescent to Adult Health (Add Health), comprising 13,926 participants, revealed that geographic and contextual socioeconomic factors during adolescence exhibited a stronger correlation with hypertension in young adulthood than individual-level risk factors. This evidence supports the notion that the low R2 observed in the age - blood pressure pathway does not signify a deficiency in the model, but rather an appropriate representation of the multifaceted complexity inherent in the etiology of urban hypertension [27, 28].
The inverse correlation between the age-psychological distress pathway (β = −0.116; R2 = 0.042) signifies a paradoxical result that necessitates comprehensive analysis. Modern literature substantiates that younger demographics exhibit greater incidences of psychological suffering [29-31]. Numerous studies with DASS-21 have indicated that the prevalence rates of depression and anxiety among teenagers, university students, and older persons are 25.9%/46.6%, 53.7%/61.5%, and 7.2%/22.5%, respectively [4]. A study in Hong Kong indicated that among a sample of university students (n = 1,648), the prevalence of moderate-to-severe depression was 40.0%, anxiety was 50.7%, and stress was 22.2%, with a significant correlation with younger age and elevated levels of psychological distress [5].
This phenomenon can be elucidated by conceptual frameworks pertaining to the aggregation of many stressors among younger generations, such as early career competitiveness, elevated productivity expectations, future uncertainties, and financial obligations [28]. A study by Evering et al. (2025) using a daily stress paradigm revealed that negative affective reactivity to daily stressors in normotensive young adults was positively correlated with beat-to-beat blood pressure variability, suggesting a persistent sympathetic activation in individuals lacking a formal hypertension diagnosis [32].
The inverse relationship between blood pressure and psychological distress (β = −0.128) may seem counterintuitive, although it can be elucidated through many pathophysiological and psychological causes. Initially, an early compensatory phase may occur: in young adults, significant psychological stress activates the hypothalamic-pituitary-adrenal (HPA) axis and induces release of catecholamines (norepinephrine and epinephrine), resulting in increased blood pressure prior to the internalization or subjective perception of psychological distress [33, 34]. Data from the Multi-Ethnic Study of Atherosclerosis (MESA), comprising 412 participants, indicated that elevated levels of urinary stress hormones (norepinephrine, epinephrine, and cortisol) correlated with heightened risk of developing hypertension, with more pronounced associations in individuals under 60 years of age. The findings indicate that the cardiovascular system may react to stress prior to the subjective experience of psychological distress [35].
The phenomenon of habituation and more mature coping mechanisms in older age may contribute to this pattern. A longitudinal study by Hildrum et al. (2011) in a Norwegian population (n = 17,410; 22-year follow-up) found that persistently high levels of anxiety and depressive symptoms were paradoxically associated with reductions in systolic (−1.59 mmHg, p = 0.004) and diastolic blood pressure (−0.78 mmHg, p = 0.019), as well as a 20% lower risk of developing hypertension. These findings suggest that chronic psychological distress may be linked to lower blood pressure through complex mechanisms, potentially involving behavioral changes, reduced cardiovascular reactivity due to habituation, or alterations in autonomic regulation. In older populations, more mature psychological coping strategies and diminished stress reactivity may attenuate subjective distress despite an increasing burden of cardiovascular disease [36].
Disease labeling and medical knowledge may also be influential. A study conducted by Hamer et al. (2010) with 33,105 adult participants found that awareness of a hypertension diagnosis correlated with heightened psychological distress, attributable not to the direct physiological effects of elevated blood pressure, but rather to disease labeling and illness-related anxiety. Conversely, those with undetected hypertension did not demonstrate heightened psychological discomfort despite elevated blood pressure levels [37].
The sandwich generation framework offers a crucial analytical perspective for comprehending why classical metabolic pathways (dyslipidemia: β = 0.013, R2 = 0.054; body fat profile: β = 0.033, R2 = 0.091) have a negligible impact on psychological distress, while the cardiovascular system exhibits a pronounced early response. Urban young to middle-aged adults face a combined burden, comprising professional obligations (career progression, performance metrics), familial responsibilities (childcare), and financial assistance and caregiving for elderly parents [38-41].
A study utilizing the China Health and Retirement Longitudinal Study (CHARLS; n = 12,186) revealed that individuals in the sandwich generation, characterized by having at least one living parent and at least one grandchild under 16 years, exhibited a higher body mass index (BMI) than those outside this demographic (24.2 vs. 23.7). Moreover, high-intensity caring (≥1,000 hours annually) is correlated with elevated BMI in women, signifying a physiological effect of accumulated caregiving responsibilities [40]. Data from the U.S. Behavioral Risk Factor Surveillance System (BRFSS), engaging 8,805 sandwich caregivers, indicated that younger caregivers (aged 30-39 years) had inferior mental health, whereas older caregivers (aged 50-59 years) demonstrated diminished physical health. These data collectively affirm that psychological discomfort in the sandwich generation typically manifests in mental health consequences prior to quantifiable metabolic abnormalities [39].
In Indonesia, the challenges faced by the sandwich generation are exacerbated by the cultural traditions that perceive intergenerational support as a moral and social duty. Qualitative investigations conducted in Iran during the COVID-19 pandemic revealed that women in the sandwich generation faced a “double caregiving burden,” resulting in significant negative effects on both mental and physical health. This research emphasized the necessity for initiatives to enhance access to information and communication technology, alternative methods to rigid social isolation, the development of work-life balance, as well as early psychological evaluation and comprehensive government support [38, 39, 42].
The molecular mechanisms connecting psychosocial stress to increased blood pressure have been thoroughly detailed in neurophysiological literature. Chronic stress leads to sustained activation of the hypothalamic-pituitary-adrenal (HPA) axis, causing consistently increased cortisol levels. Elevated cortisol results in hippocampal atrophy, synaptic dysfunction, and neuroinflammation—factors that facilitate the onset of Alzheimer’s disease and depression, while concurrently heightening cardiovascular risk [43-45]. Ulrich-Lai and Herman (2009) stated that the neural regulation of endocrine and autonomic stress responses entails intricate circuits within the limbic forebrain, hypothalamus, and brainstem, with glucocorticoid feedback mechanisms being pivotal in modulating the intensity and duration of glucocorticoid release [33].
The activation of the sympathetic nervous system constitutes a vital parallel channel. Exposure to stressors activates preganglionic sympathetic neurons in the intermediolateral column of the thoracolumbar spinal cord, which then project to pre- or paravertebral ganglia and to chromaffin cells of the adrenal medulla. This activation results in heightened secretion of norepinephrine and epinephrine, thus augmenting cardiac output and peripheral vascular resistance, the two primary factors influencing blood pressure [33, 46]. A prospective study by Inoue et al. (2021) revealed that elevated urinary stress hormone levels correlated with a heightened risk of developing hypertension over a median follow-up period of 6.5 years (per doubling: norepinephrine aHR = 1.31; epinephrine aHR = 1.21; dopamine aHR = 1.28; cortisol aHR = 1.23) [35].
Furthermore, excessive cardiovascular reactivity to acute stress has been identified as an independent predictor of the development of hypertension [47, 48]. Gianaros and Sheu (2009) emphasized that negative emotional reactivity and psychological stress in daily life are associated with greater ambulatory blood pressure variability, a key contributor to cardiovascular disease risk [49-52]. Among normotensive young adults, negative affective responsiveness to daily stressors has been positively correlated with increased beat-to-beat blood pressure variability and total peripheral resistance (TPR) variability, indicating chronic sympathetic activation that serves as a precursor to hypertension [32].
The discovery that skeletal muscle mass (R2 = 0.181) is significantly affected by hemoglobin (β = 0.383) has a minimal impact on psychological distress (β = −0.054), highlighting that physical capability alone is inadequate for safeguarding mental health in the presence of structural stressors. The exercise physiology literature consistently illustrates a positive linear correlation between skeletal muscle mass and aerobic capacity, wherein increased muscle mass correlates with elevated peak oxygen consumption (VO2peak). Hemoglobin is pivotal in oxygen transport ability, and elevations in red blood cell mass and total hemoglobin represent fundamental physiological adaptations to endurance training [3, 53-55].
In metropolitan environments, individuals may exhibit physical “health,” characterized by sufficient aerobic capacity and skeletal muscle mass, but their stress systems are significantly active due to substantial psychosocial pressures [56-58]. Findings from the CARDIA (Coronary Artery Risk Development in Young Adults) study suggest that the association between skeletal muscle mass and aerobic capacity does not provide immunity against psychological distress in healthy individuals subjected to chronic stressors [53].
Dyslipidemia's negligible contribution (β = 0.013; R2 = 0.054) to psychological discomfort suggests that traditional metabolic pathways insufficiently account for the mental health challenges faced by metropolitan young adults. This observation aligns with findings from sandwich generation studies, indicating that while this group typically displays elevated BMI and increased dyslipidemia, mental health outcomes are more significantly influenced by dual role burdens, time constraints, and psychosocial stressors than by metabolic parameters [38, 40, 59].
This model illustrates a basic urban epidemiological transition in which blood pressure and psychological distress are no longer adhere to the traditional linear age trajectory, but instead migrate toward younger demographics due to socioeconomic pressures and the sandwich generation phenomenon [59]. This transition signifies an evolving global epidemiological context, where cardiovascular diseases often linked to older demographics are now more prevalent among young adults, especially in low- and middle-income nations experiencing swift urbanization [21, 22].
The Global Burden of Disease 2019 study revealed an escalation in alcohol-related cardiovascular complications, such as atrial fibrillation and hypertensive heart disease, among young and middle-aged adults, shown by the increasing age-standardized death rates (ASDR) in Southeast Asia (+2.82%) and the Western Pacific (+1.48%) [60]. The occurrence of premature cardiovascular aging endangers individual health as well as national production, social advancement, and economic stability [22].
Low path coefficients and R2 values for psychological distress should not be viewed as deficiencies of the model, but rather as a compelling indication that mental and cardiovascular health in urban young adults is influenced by macro-social forces that transcend conventional biological and demographic factors. Consequently, interventions must transition from solely therapeutic methods to inclusive structural strategies. First, it is essential to implement workplace health rules that tackle excessive working hours, encourage remote work flexibility, and offer employee help programs for stress management [26, 61]. Canella et al. (2023) provided evidence that mindfulness-based stress reduction (MBSR) programs significantly decreased perceived stress (p = 0.002) and anxiety (p = 0.05), while also reducing systolic and diastolic blood pressure (p = 0.02; p = 0.001), cortisol levels (p = 0.01), and pro-inflammatory cytokines IL-6 and IL-8 [62].
Secondly, enhanced social security for the sandwich generation is needed, encompassing subsidies for elder care (such as long-term care insurance), inexpensive childcare facilities, and financial assistance for households managing multiple caregiving obligations. Empirical evidence demonstrates that various caring roles correlate with increased depression levels, whereas elevated self-esteem may partially attenuate and mitigate these negative consequences [38, 41, 42]. Furthermore, the early screening and identification of hypertension in young adults (18-40 years) should be enhanced via community-based screening initiatives and the incorporation of blood pressure monitoring into primary healthcare services [23]. Data suggest that access to a primary care physician correlates with improved blood pressure regulation (PR = 0.54 in fully adjusted models) [63].
Numerous constraints must be acknowledged while analyzing these results. The cross-sectional design restricts the capacity to determine temporal causality among variables. Longitudinal studies with many time points are essential to monitor the trajectories of blood pressure and psychological distress throughout aging and sandwich generation status [2-4]. Secondly, while low R2 values have been perceived as indicative of the intricacy of macro-social factors, directly measuring specific stressors (such as work-related stress, caring load, and economic strain) would enhance construct validity [25, 28, 29, 58]. The cultural and contextual variants of the sandwich generation phenomena in Indonesia necessitate comprehensive qualitative research to elucidate coping mechanisms and resilience processes that may diverge from those found in Western societies [32, 38, 41, 64-66].
Subsequent study ought to incorporate the evaluation of stress-related biomarkers (salivary cortisol, urine catecholamines, inflammatory markers), heart rate variability, and beat-to-beat blood pressure fluctuation to accurately capture real-time psychophysiological dynamics [11, 13, 14, 17, 35, 52]. Ecological momentary assessment (EMA) methods may yield detailed data on variations in psychological discomfort and blood pressure in the context of daily life [67]. Furthermore, multilevel intervention trials, encompassing workplace wellness initiatives, caregiving leave policies, and urban environmental alterations, are essential to assess the efficacy of comprehensive strategies in alleviating cardiovascular and psychological burdens among urban youth populations [17, 18, 63, 66].
Several potential sources of bias should be acknowledged. The use of consecutive community-based sampling may introduce selection bias and limit representativeness of the broader urban population. The cross-sectional design precludes causal inference between psychological distress and metabolic parameters. Psychological outcomes assessed using self-reported DASS-42 questionnaires may also be subject to recall and response bias. Residual confounding from unmeasured variables such as socioeconomic status, occupational stress, sleep quality, physical activity, dietary patterns, and prior psychiatric history may persist despite statistical adjustment. In addition, body composition assessment using bioelectrical impedance analysis may be influenced by hydration status and other physiological conditions. Finally, because the study was conducted exclusively in Jakarta, the generalizability of findings to non-urban populations may be limited.
CONCLUSION
This study presents empirical evidence that urban epidemiological transitions have altered disease burden patterns, with hypertension and psychological distress increasingly impacting younger, working-age populations instead of being limited to older persons. This transition seems to coincide with rapid urbanization, increasing economic demands, and broader social obligations that define modern urban existence. The comparatively low R2 values for age and psychological distress should not be viewed as shortcomings of the model; instead, they signify that cardiovascular and mental health outcomes in urban populations are fundamentally multifactorial, significantly shaped by social, occupational, and environmental factors in addition to biological aging alone.
The observed patterns indicate an association between physiological characteristics and psychological distress in urban adults. In this context, indicators of physical capacity, such as skeletal muscle condition and hemoglobin concentrations, coupled with traditional metabolic markers like dyslipidemia, appeared to provide only minimal associations with mental health when structural stressors prevail. These findings highlight the importance of public health strategies that extend beyond individual-centered clinical approaches to include integrated interventions, such as workplace health policies, life-course social protection, urban environmental improvements, and early cardiovascular risk screening among younger adults. Collectively, these findings contribute to the growing field of urban health research and support the development of context-specific interventions to address the coexistence of cardiovascular and mental health challenges in rapidly urbanizing settings.
STUDY LIMITATIONS
Several limitations should be considered when interpreting the findings of this study. First, the cross-sectional design precludes the establishment of temporal or causal relationships among age, metabolic health, blood pressure, and psychological distress. Although the proposed structural model provides valuable insights into the interrelationships among these variables, the observed associations should be interpreted within the context of their correlational nature. Second, participants were recruited using consecutive sampling from five administrative regions of Jakarta. While this approach enabled the inclusion of a large and diverse urban population, the findings may not be fully generalizable to rural communities or populations with different demographic and sociocultural characteristics.
Third, psychological distress was assessed using the Depression Anxiety Stress Scale-42 (DASS-42), a validated self-report instrument that reflects participants' perceived symptoms rather than clinically established psychiatric diagnoses. Consequently, the possibility of reporting bias and individual differences in symptom perception cannot be entirely excluded. Furthermore, although the present model incorporated multiple physiological and metabolic indicators, the explained variance for psychological distress remained modest (R2 = 0.042), indicating that psychological well-being is influenced by a broader range of determinants beyond the biological variables examined in this study. Factors such as socioeconomic status, educational attainment, occupational demands, physical activity, dietary habits, sleep quality, social support, life events, medication use, and pre-existing chronic conditions were not comprehensively evaluated and may have contributed to the unexplained variance.
AUTHORS’ CONTRIBUTIONS
The authors confirm their contribution to the paper as follows: ARB and NST conceptualized the study, led the research design, supervised data collection, and critically revised the manuscript for important intellectual content. YF contributed to study conception, methodology development, statistical analysis and interpretation of data, and drafting of the original manuscript. ARB participated in data acquisition, coordination of field activities, and data curation. EW contributed to laboratory coordination, biochemical data interpretation, and quality control of laboratory procedures. AHS and HS provided input on methodological design, data interpretation, and manuscript review. TS assisted in participant recruitment, field data collection, and preliminary data processing. MFD, DD, RKW, and BAW contributed to data collection, questionnaire administration, anthropometric and physiological measurements, and data entry.
LIST OF ABBREVIATIONS
| ALT | = Alanine Aminotransferase |
| AST | = Aspartate Aminotransferase |
| BIA | = Bioelectrical Impedance Analysis |
| BMI | = Body Mass Index |
| Cr | = Creatinine |
| DASS-42 | = Depression Anxiety Stress Scale-42 |
| DBP | = Diastolic Blood Pressure |
| Hb | = Hemoglobin |
| HDL-C | = High-Density Lipoprotein Cholesterol |
| LDL-C | = Low-Density Lipoprotein Cholesterol |
| PLS-SEM | = Partial Least Squares-Structural Equation Modeling |
| R2 | = Coefficient of Determination |
| SBP | = Systolic Blood Pressure |
| SGOT | = Serum Glutamic-Oxaloacetic Transaminase |
| SGPT | = Serum Glutamic-Pyruvic Transaminase |
| SmartPLS | = Smart Partial Least Squares Software |
| SMI | = Skeletal Muscle Index |
| SPSS | = Statistical Package for the Social Sciences |
| TC | = Total Cholesterol |
| TG | = Triglycerides |
| β | = Standardized Path Coefficient |
AI DISCLOSURE
Grammarly was used exclusively as a language-editing and grammar-checking tool, primarily for grammar, spelling, punctuation, sentence structure, and language clarity. It was not used to generate scientific content, perform statistical analyses, interpret the study findings, develop the research methodology, or make scientific decisions. We acknowledge that automated AI-detection systems may identify certain linguistic patterns as potentially AI-generated. However, such detection scores alone cannot establish the origin of the scientific content. The authors remain fully responsible for the scientific content, data, statistical analyses, interpretation, and conclusions presented in the manuscript.
ETHICS APPROVAL AND CONSENT TO PARTICIPATE
Ethical approval for this study was initially obtained in August 2024 from the Universitas Tarumanagara Human Research Ethics Committee, Institute of Research and Community Engagement, and subsequently renewed twice. The final ethical approval number for this study is No. 006-UTHREC/UNTAR/II/2026.
CONSENT FOR PUBLICATION
All participants received explicit information concerning the study's objectives, the voluntary nature of their involvement, and their entitlement to withdraw at any moment without repercussions. Engagement in the study and fulfilment of the anonymous survey were considered implicit informed consent. Participants were assured that all gathered data were anonymized and could not be utilized to identify people. The study did not necessitate individual authorization for publishing, as it did not include personal or identifying information. The authors affirm that the distribution of aggregated results presents no risk to participants and is meant exclusively for scientific and scholarly objectives.
AVAILABILITY OF DATA AND MATERIAL
All the data and supporting material is available within the article.
FUNDING
This study was funded by the Institute of Research and Community Engagement, Universitas Tarumanagara, for the 2025-2026 funding period.
ACKNOWLEDGEMENTS
The authors would like to express their sincere gratitude to the local subdistrict authorities and community coordinators across the five administrative regions of Jakarta for their support in facilitating participant recruitment and data collection. We also acknowledge all participants who generously contributed their time and cooperation to this study. Special thanks are extended to the healthcare personnel and field enumerators involved in data acquisition, physical examinations, and laboratory procedures for their dedication and adherence to standardized protocols. This study would not have been possible without their valuable assistance and collaboration.