All published articles of this journal are available on ScienceDirect.

Spatial Disparities and associated Factors with the Number of Children Ever Born among Rural Ethiopian Women
Authors Info & Affiliations
Abstract
Introduction
The phrase “children ever born” refers to the total number of children a woman has during her lifetime, which is considered one of the three primary factors influencing a country's population size, composition, and structure. This study aimed to examine the spatial differences in the number of children ever born and related factors among women of reproductive age in rural Ethiopia.
Methods
This study utilized data from the 2019 Ethiopian Mini Demographic and Health Surveys, focusing on 5,934 rural women aged 15–49 years. Of the four count regression models considered, the zero-inflated Poisson regression model was identified as the most suitable for the data. Additionally, a spatial analysis was conducted to evaluate spatial dependencies across different zones in Ethiopia.
Results
In Ethiopia, rural women typically have an average of 3.1 children throughout their lives. The distribution of the total number of children born was spatially clustered across different zones of Ethiopia (Moran's I=0.17). Notable hotspot areas were found in Shinile, Fik, Gode, Warder, Guji, Gurage, and West Harerge. Women who had their first child before turning 19 years old showed an IRR of 1.341 (IRR = 1.341), suggesting a higher likelihood of having more children than others. Conversely, women who practiced family planning (IRR = 0.961) compared to those who did not practice were less likely to have more children.
Discussion
The study, consistent with previous studies, shows that higher women’s education and wealth status, and use of family planning are associated with fewer children ever born, whereas experiences such as child mortality and early childbirth increase fertility, , highlighting the importance of improving reproductive health services, education, and socio-economic conditions to influence fertility patterns among rural Ethiopian women.
Conclusion
The study, consistent with previous studies, shows that higher women’s education and improved wealth status, as well as the use of family planning, are associated with fewer children ever born, whereas experiences such as child mortality and early childbirth increase fertility, highlighting the importance of improving reproductive health services, education, and socio-economic conditions to influence fertility patterns among rural Ethiopian women.
1. INTRODUCTION
The term “children ever born” refers to the number of children born alive to a woman up to a specified reference date (reproductive age 15-49), and is also referred to as the lifetime fertility of a woman. It includes children who have died after birth, while it does not include stillborn children, abortions, or children adopted by the person [1]. Lifetime fertility is one of the three key factors, along with mortality and migration, which determine a country's population size, composition, and structure [2]. Globally, women are having fewer babies, but fertility rates remain high in some regions [3, 4]. The global fertility rate has decreased from 4.9 live births per woman in 1950 to 2.2 in 2021 [5]. Since the middle of the twentieth century, the world’s population has more than tripled, reaching almost 8 billion in 2022, and the world population is expected to peak at almost 11 billion around 2100. Most of this growth will occur in low- and lower-middle-income countries [6]. Rapid population growth poses significant challenges for low- and lower-middle-income countries, making it difficult to meet the rising per capita public expenditure required to reduce poverty, combat hunger and malnutrition, and ensure universal access to healthcare, education, and other essential services [6].
In recent decades, fertility rates in Africa have consistently surpassed those in other developing regions, a phenomenon often linked to the region's relatively lower socioeconomic development [7]. The total fertility rate in sub-Saharan Africa has declined notably, dropping from 6.94 births per woman in 1950 to 4.29 in 2021, indicating a significant demographic transformation over the past 70 years [5]. Despite this, the region continues to have the highest fertility rates, and the reduction in fertility has been relatively gradual and has started later than in other regions such as Northern Africa, Latin America, and others [3-5, 8]. Although several countries in the region, including Ethiopia, have experienced notable declines in total fertility rates in recent years, the overall reduction remains modest [4].
Ethiopia, with a population of over 112 million in 2020, is the second most populous country in Africa, after Nigeria. This accounts for approximately 1.45% of the global population [9]. Between 2016 and 2021, Ethiopia observed a reduction in its total fertility rate, which declined from 4.6 to 4.1. Despite this decrease, the country's total fertility rate remains comparatively high relative to the global average [5, 10]. Family size is important not only for a country's well-being but also for the welfare and health of individuals, families, and communities. High fertility rates combined with rapid population growth can increase maternal and paediatric illnesses and mortality [11].
The 2016 Ethiopian Demographic and Health Survey report revealed that women in rural areas tend to have about three more children throughout their reproductive years than those in urban areas. On average, rural women have 5.2 children, whereas urban women have 2.3 children [10]. This data underscores the considerable difference in fertility rates between Ethiopia's rural and urban populations. In rural communities, having a large number of children is often desired for assistance with farming and to provide emotional and financial support in their later years [12]. The total fertility rate for women living in rural areas declined from 6.0 children in 2000 to 5.2 children in 2016 [10].
Many researchers in different countries, including Ethiopia, have conducted numerous studies to determine the factors influencing the number of children ever born, applying a variety of statistical models [1, 13-23]. These studies have consistently identified educational status, women’s age, use of family planning, age at first marriage, family size, access to mass media, marital status, child mortality experience, age at first birth, religion, employment status, region, preceding birth interval, and household wealth as significant predictors of fertility outcomes. At the same time, spatial disparities in maternal and reproductive health outcomes remain a critical concern across sub-Saharan Africa, including Ethiopia. Previous research has documented substantial regional differences in key indicators, such as home delivery, antenatal care utilization, induced abortion, and birth intervals, underscoring the influence of socio-demographic, cultural, and health system–related factors in shaping these variations. However, the factors associated with the number of children ever born and the spatial disparities across zones of Ethiopia-both of which are fundamentally important for policy formulation and implementation-have not been well addressed among women of reproductive age. Extending the current evidence base by investigating the spatial disparities and associated determinants of the number of children ever born among rural Ethiopian women provides a valuable opportunity to better understand fertility dynamics and design targeted policy interventions aimed at reducing inequalities [24-30]. In Ethiopia, the total number of children ever born has been studied by various researchers [14, 15, 17, 31-34], but none have examined spatial dependency or spatial disparities at the zonal level in rural Ethiopia.
This study seeks to evaluate the geographical disparities in the total number of children born and factors influencing this among women of childbearing age in rural Ethiopia, utilizing data from the nationally representative 2019 Ethiopian Mini Demographic and Health Survey (EMDHS). This study intended to improve access to reproductive health services, promote contraceptive education, and address social and cultural influences on reproductive choices in rural Ethiopia. Furthermore, this effort is crucial for empowering women and providing them with the necessary support to make informed decisions, potentially leading to a reduction in the total number of children born. Consequently, this could positively affect reproductive health outcomes in rural Ethiopia.
2. METHODS AND MATERIALS
2.1. Study Area and Population
This study was conducted in Ethiopia, a country located in Eastern Africa. Ethiopia is a landlocked nation situated in the Horn of Africa, positioned between 3° and 15° north latitude and 33° and 48° east longitude [35]. It shares borders with six countries: Eritrea, Djibouti, Somalia, Kenya, South Sudan, and Sudan. Ethiopia has 12 regional states, two administrative cities (Addis Ababa and Dire Dawa), and 84 zones (Fig. 1). The study population consisted of women of reproductive age (15-49 years) living in rural areas of Ethiopia.
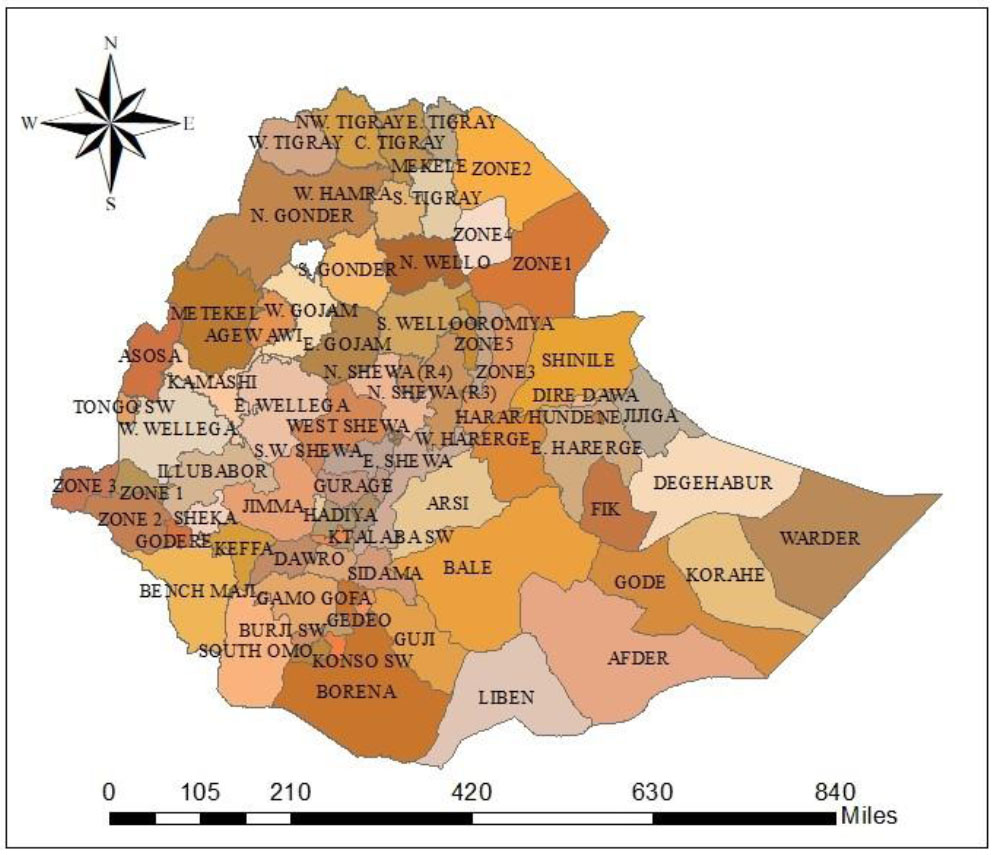
Administrative zones of Ethiopia for the study.
2.2. Data Source and Study Design
This study used secondary data from the 2019 EMDHS, which was conducted by the Central Statistical Agency, and the data were accessed through the DHS website: https://dhsprogram.com. The Ethiopian Public Health Institute conducted the survey in collaboration with the Central Statistical Agency and the Federal Ministry of Health, with technical assistance from the Integrated Control Framework (ICF), along with financial and technical support from development partners. The survey was conducted from March 21, 2019, to June 28, 2019, and used a population-based cross-sectional study design in which women were interviewed using a birth history questionnaire [10, 36].
2.3. Sampling Procedure
The sampling frame for the 2019 EMDHS comprised all census enumeration areas (EAs) established for the 2019 Population and Housing Census (PHC) and provided by the Central Statistical Agency [10]. An EA is a geographic area that covers an average of 131 households [36]. The sampling process for the 2019 EMDHS involved two stages of stratification and selection. To ensure representation from different areas, each region was divided into urban and rural areas, resulting in 21 sampling strata. In each stratum, samples of EAs were independently selected using a two-stage process. In the first stage, a sample of 305 EAs was selected based on the probability proportional to the size of each EA, while maintaining independent selection within each sampling stratum. In the subsequent selection stage, 30 households per cluster were selected using an equal-probability systematic sampling method from the newly generated household listings [36]. The survey was open to all females between the ages of 15 and 49 who were either regular members of the chosen households or had stayed overnight in the selected households prior to the survey.
2.4. Variables in the Study
This study identified the total number of children ever born as the dependent variable, treating it as a count variable. The independent variables considered were educational level (educated versus uneducated/nonformal education), respondents' current age groups (15-19, 20-29, 30-39, and 40-49), family planning utilization (yes or no), marital status (single or married), whether mothers had experienced child mortality (yes or no), age at first birth, religious affiliation (Orthodox, Muslim, and others), and wealth index (rich, poor, and middle). The wealth index is a composite measure of a household’s overall living standard. It is constructed using readily available information on household ownership of selected assets (e.g., televisions, bicycles), characteristics of the dwelling (e.g., flooring and roofing materials), and access to water and sanitation facilities. Each household asset is assigned a weight (factor score) generated through principal components analysis (PCA). The resulting asset scores are then standardized to a normal distribution with a mean of zero and a standard deviation of one. These standardized scores are used to determine the cut-off points that define the five wealth quintiles-Lowest, Second, Middle, Fourth, and Highest-each representing 20% of segment of the population. Quintile 1 reflects the poorest households, while Quintile 5 represents the wealthiest. For ease of interpretation, we aggregated these five categories into three groups in this study.
2.5. Spatial Analysis
2.5.1. Spatial Autocorrelation
Spatial autocorrelation assesses the relationship between variables and the extent to which a specific phenomenon is spatially correlated with itself or neighbouring areas [37]. Global spatial autocorrelation is defined as a measure of the overall clustering of data, which provides a correlation statistic to summarize the entire study area [38]. In this study, we used the Global Moran’s I statistic to evaluate whether the distributions of the total number of children ever born per woman were dispersed, clustered, or randomly distributed in the zones of Ethiopia. It was used to detect spatial autocorrelation in the total number of children ever born per woman: calculated Moran’s I values close to −1 indicate dispersion, while values close to +1 indicate clustering, and values of zero indicate a random distribution [30, 37, 38].
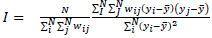
A statistically significant Moran’s I (p-value < 0.05) leads to the rejection of the null hypothesis (spatial independence) and indicates the presence of spatial autocorrelation. The Moran’s I statistic of spatial autocorrelation is calculated as (1):
 (1)
(1)
Where yi and yj are the values of the variable of interest at zones i and j, and wij are the elements of the spatial weight matrix (W), which has a dimension of N x N (here, N=84) [37, 38]. It is represented as follows, Eq. (2):
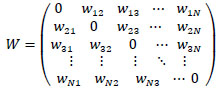 (2)
(2)
Where N indicates the number of zones in the country.
2.5.1.1. Getis-Ord Analysis
The Getis-Ord
 statistics were utilized to assess the spatial autocorrelation fluctuations within the study area by calculating the
statistic for each zone i. The Z-score was used to evaluate clustering significance, and the p-value was calculated to assess statistical significance [39, 40]. The local
statistics were utilized to assess the spatial autocorrelation fluctuations within the study area by calculating the
statistic for each zone i. The Z-score was used to evaluate clustering significance, and the p-value was calculated to assess statistical significance [39, 40]. The local
 was used to test the statistical significance of localized clusters, and to establish the spatial extent of these clusters. The local
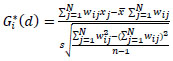
-statistic is given as follows (3):
was used to test the statistical significance of localized clusters, and to establish the spatial extent of these clusters. The local
-statistic is given as follows (3):
 (3)
(3)
where wij(d) is the spatial weight between location j (within the distance of d from neighbouring location i) and location i, x̄ is the mean and s is the standard deviation of the variable of interest across all locations [41].
A high
statistic indicates “hot-spot” areas, whereas a low
statistic indicates a “cold-spot” area [40]. Hotspots are geographical units with a high value of interest, surrounded by other geographic units with similar high values of interest. Similarly, cold spots are geographic locations with low values of interest surrounded by other geographic units with low values of interest [42, 43].
2.5.2. Spatial Interpolation
The Spatial interpolation technique was applied to predict data points that were not directly measured using data from sampled locations. The ordinary Kriging spatial interpolation method was used to make predictions and produce smooth representations of the variables of interest [44]. The ordinary Kriging method considers the statistical properties of the measured data (spatial autocorrelation) and uses a semivariogram to model spatial continuity [45].
2.6. Poisson Regression Model
Poisson regression is frequently employed in the examination of count data, under the premise that the mean and variance of the dependent variable are equivalent [46]. Let, yi represent counts of events occurring in a given time or exposure period with rate μi, which are Poisson random variables with the probability mass function defined as (4):
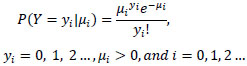 (4)
(4)
Where yi denotes the total number of children ever born for the ith woman in a given time or exposure period, with a parameter μi. In the Poisson regression model, the variance is equal to the mean (5):
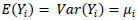 (5)
(5)
Where
 and this property of the Poisson distribution is known as equi-dispersion.
2.6.1. Negative Binomial Regression Model
The negative binomial (NB) regression model is an alternative approach for examining count data, especially useful when the Poisson regression model is inadequate due to over-dispersion, a condition where the variance surpasses the mean [47, 48]. The probability mass function for a negative binomial random variable is given by (6):
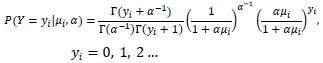 (6)
(6)
Where α is the over-dispersion parameter and Γ(.) is the gamma function. When α = 0, the negative binomial distribution is the same as the Poisson distribution. The mean and variance are expressed as follows (7):
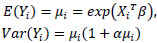 (7)
(7)
2.7. Zero-Inflated Model
Zero-Inflated models are beneficial for examining data characterized by non-negative, highly skewed sequence counts with a significant number of zeros [49]. These models, called two-part models, allow for two different processes: one determines whether the value is zero or positive (participation part), and the other drives the value of the strictly positive count (amount part) [50].
2.7.1. Zero-Inflated Poisson Regression Model
The zero-inflated Poisson (ZIP) regression model is a variation of the well-known Poisson regression model that accommodates excess zero counts in the dataset [51]. The data distribution is a combination of the Poisson distribution and the logit distribution, where the values of Y can take on nonnegative integer values such as 0, 1, 2, 3, and so forth [50, 52]. The fundamental concept revolves around data originating from two distinct components. In one component, the result consistently yields a count of zero, whereas in the other component, the counts follow the typical Poisson process. Suppose the first case occurs with probability πi and the second case occurs with probability 1-πi [52]. The probability distribution function of the ZIP regression is given by (8):
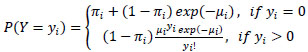 (8)
(8)
Where
 and πi is the measure of the probability of excess zeroes corresponding to the ith row [51].
2.7.2. Zero-Inflated Negative Binomial Regression Model
The zero-inflated negative binomial (ZINB) regression model is utilized for count data that exhibits both over-dispersion and a high frequency of zeros. This model integrates aspects of the negative binomial distribution with the logit distribution to accurately represent the distinct features of the data. The potential values include non-negative integers: 0, 1, 2, 3, and so on [53]. Consider a situation where each observation can be categorized into one of two possible scenarios. In scenario 1, the count is zero, while in scenario 2, the counts are generated according to the negative binomial model, which also includes zeros. Let us assume that case 1 transpires with a probability of πi, while case 2 transpires with a probability of 1 – πi [52]. Therefore, the probability distribution of the ZINB random variable Yi can be written as (9):
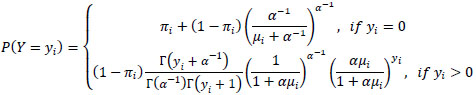 (9)
(9)
where πi is the probability of an extra zero response, μi is the mean and α is the dispersion parameter of the underlying negative binomial distribution [53].
3. RESULTS
The study included 5,934 women who resided in rural areas of Ethiopia. The variable of interest was the total number of children ever born to these women. The women in the study had between 0 and 15 children in their lifetimes. The average number of children ever born per mother was 3.047, with a standard deviation of 2.9 (Table 1).
| Response Variable | Total | Mean | Variance | Standard Deviation |
|---|---|---|---|---|
| Children ever born | 5934 | 3.047 | 8.6 | 2.9 |
In Fig. (2), it is evident that out of the total number of women surveyed, 1,736 (29.26%) had never experienced childbirth during their lifetime. Interestingly, only two women (0.03%) were found to have given birth to 15 children throughout their lives.
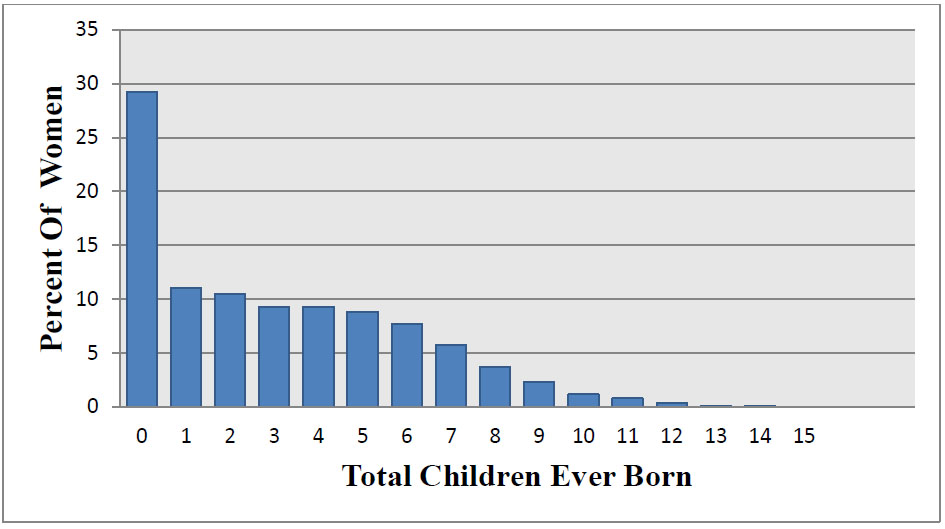
The bar chart of the total number of children ever born against the proportion of women.
Of all the participants, 1,439 (24.25%) were young women aged 15–19 years. Additionally, 3,030 respondents (51.06%) indicated that they had not received any formal education. Moreover, 4,090 women (68.92%) were married. Finally, 4,294 women (72.36%) began having children at 18 years or younger (Table 2).
| Predictor Variable | Categories | Frequency | Percent (%) |
|---|---|---|---|
| Women’s current age | 15-19 | 1,439 | 24.25 |
| 20-29 | 2,081 | 35.07 | |
| 30-39 | 1,522 | 25.65 | |
| 40-49 | 892 | 15.03 | |
| Women’s religion | Orthodox | 1,971 | 33.22 |
| Muslim | 2,564 | 43.21 | |
| Others | 1,399 | 23.58 | |
| Women’s education status | Uneducated | 3,030 | 51.06 |
| Educated | 2,904 | 48.94 | |
| Women’s wealth index | Poor | 3,180 | 53.59 |
| Middle | 1,200 | 20.22 | |
| Rich | 1,554 | 26.19 | |
| Utilization of family planning | No | 4544 | 77 |
| Yes | 1390 | 23 | |
| Age at first birth | Less than or equal to 18 | 4,294 | 72.36 |
| Greater than18 | 1,640 | 27.64 | |
| Mothers who have a dead child | No | 4,742 | 79.91 |
| Yes | 1,192 | 20.09 | |
| Marital status | Married | 4,090 | 68.92 |
| Single | 1,844 | 31.08 |
The p-value for Moran's I test on the total number of children ever born was found to be 0.00013, suggesting the presence of a significant spatial autocorrelation in the distribution of this variable across different zones in Ethiopia. The estimated value of Moran's I index was 0.171243 (Fig. 3), indicating a significant clustering in the total number of children ever born in rural areas of the country (p-value < 0.01).
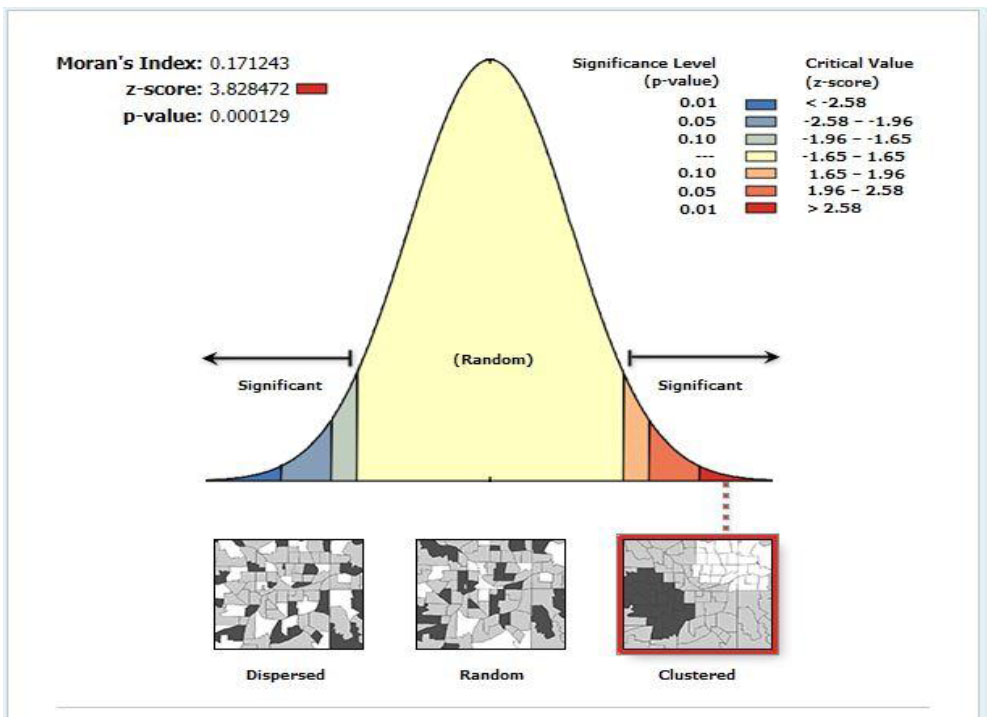
Spatial autocorrelation report of total children ever born.
The hotspot analysis results for the total number of children ever born reveal that the zones of Arsi, Bale, Fik, West Harerge, Jigjiga, Dire Diwa, and Hundene have a notably higher average number of children per mother, as depicted in Fig. (4) at the national level. Conversely, the cold spot analysis shows that zones like North Wello, South Wello, South Gonder, Bahir Dar, Kefa, Godere, Kamashi, West Shewa, East Wellega, West Wellega, Illubabur, Sheka, Bench Maji, and Wagi Himra have a lower average number of children born to mothers over their lifetimes in Ethiopia, as illustrated in Fig. (4).
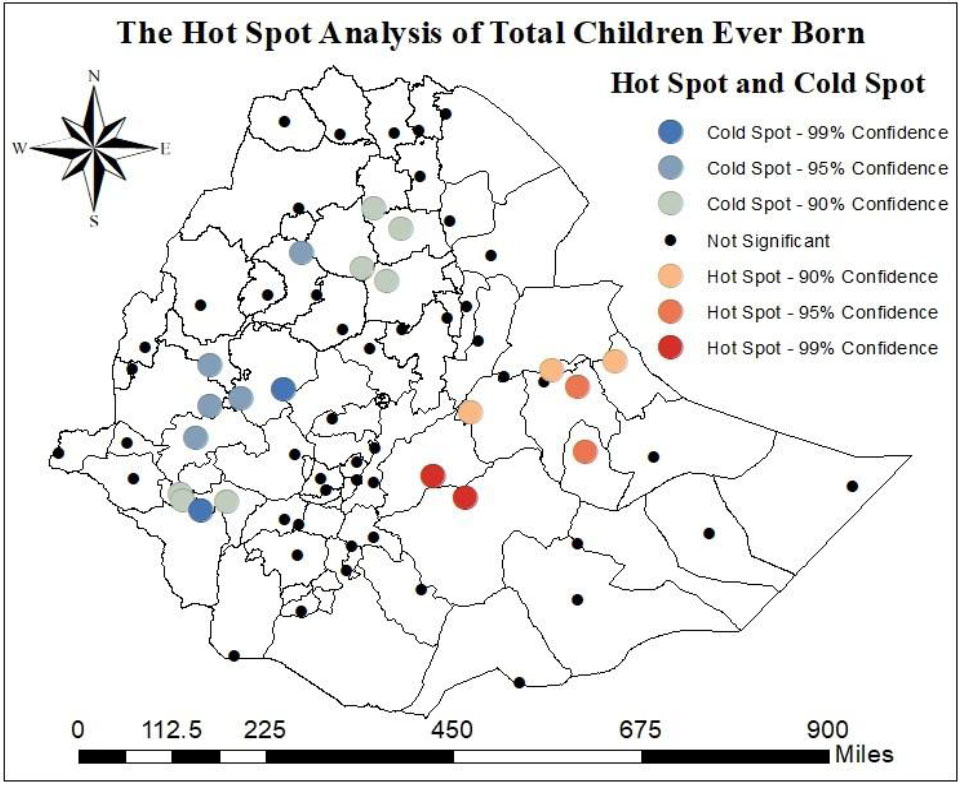
Hot-spot and cold-spot analysis of the total number of children ever born.
According to the spatial interpolation in Fig. (5), the zones of Shinile, Fik, Gode, Warder, Guji, Gurage, and West Harerge exhibit a high average number of children ever born per woman in the country. In contrast, the zones of Korahe, East Gojjam, South Wello, Illubabur, Sheka, Godere, Benchi Maji, Dawro, and Konso Special Woreda have a low average number of children ever born per woman in Ethiopia (Fig. 5).
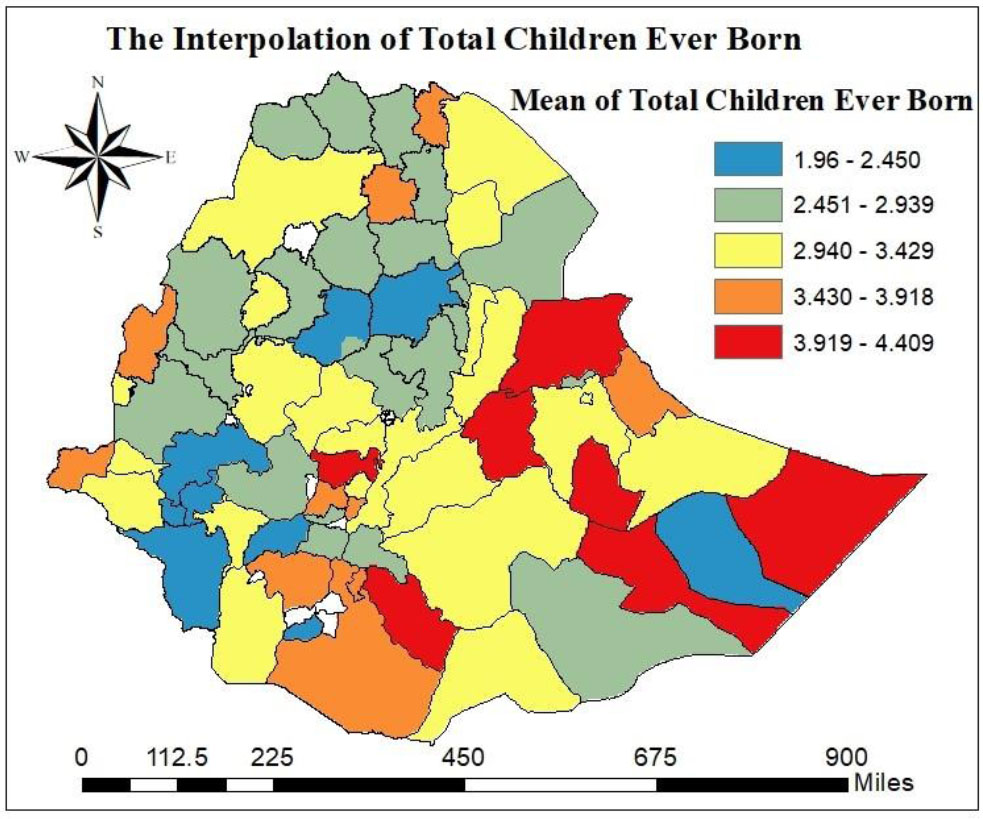
The spatial interpolation of the total number of children ever born.
Based on the Kriging interpolation analysis, it can be observed that certain zones in Ethiopia, namely Harerge, Bale, Fik, Jigjiga, East Shewa, Guji, Gedeo, and Gambela zone 3, have been predicted to have a high risk of a greater number of children being born per mother. This information is depicted in Fig. (6). Conversely, regions such as West Tigray, North-West Tigray, Central Tigray, South Tigray, South Wello, East Gojjam, North Shewa, Metekel, Kamashi, West Wellega, Illubabur, Jimma, Godere, Sheka, Bench Maji, Dawro, Basketo, Dirashe, and Konso Special Woreda were projected to have a lower risk of a higher number of children ever born per mother in the country, as illustrated in Fig. (6).
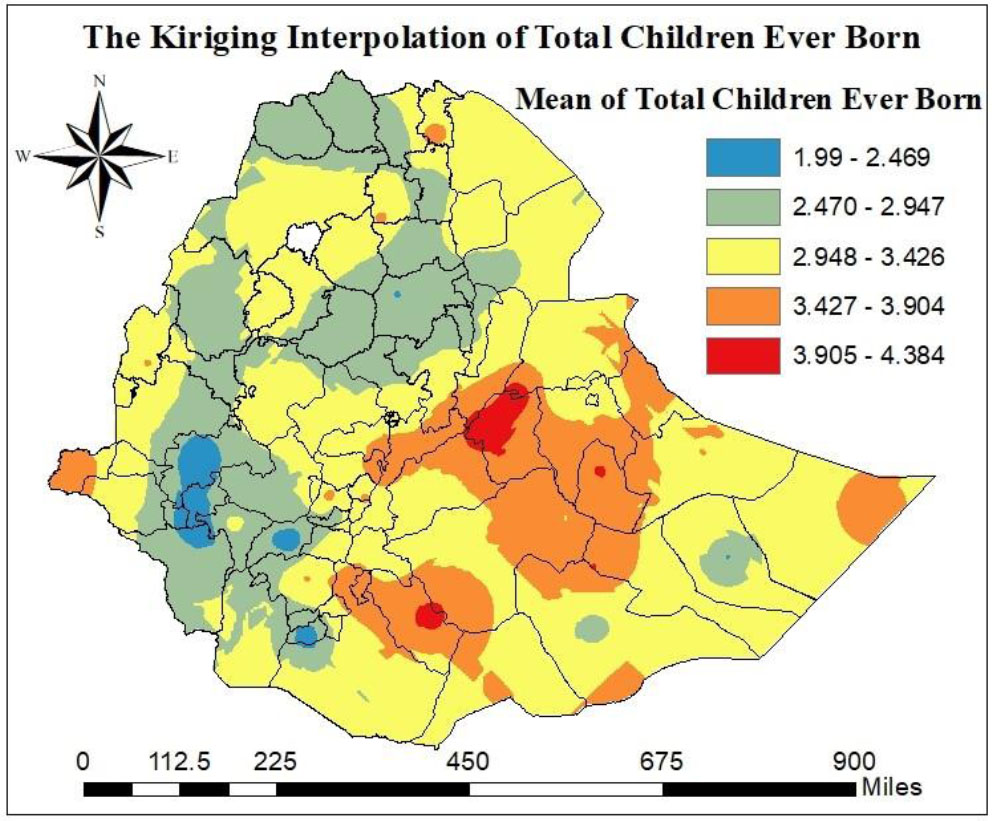
The Kriging interpolation of the total number of children ever born.
To determine the most suitable model for analyzing count data, four different count regression models were assessed: the Poisson, negative binomial (NB), Zero-Inflated Poisson (ZIP), and Zero-Inflated Negative Binomial (ZINB) models. A range of model selection criteria, such as AIC, BIC, and log likelihood, was utilized to identify the model that provides the best fit for the data. Table 3 reveals that the Poisson, NB, and ZINB regression models have the highest AIC and BIC values, along with the lowest log likelihood values, indicating that these models do not fit the data well. Conversely, the ZIP model offers the most precise depiction of the number of children ever born to rural women in Ethiopia, demonstrating superior performance and being validated by the information criteria. Based on the model selection criteria, it is clear that the ZIP regression model is the most appropriate for capturing the data's complexities and characteristics. This model effectively handles excess zeros in the data on the number of children ever born, providing a better fit than other models such as Poisson, NB, and ZINB.
| Model | AIC | BIC | Log Likelihood |
|---|---|---|---|
| Poisson | 18852.16 | 18939.11 | -9413.082 |
| NB | 18854.33 | 18947.97 | -9413.164 |
| ZIP | 17708.51 | 17882.41 | -8828.256 |
| ZINB | 17710.51 | 17891.1 | -8828.256 |
Table 4 presents the outcomes of the ZIP regression model.
| Poisson Model Part | |||||
|---|---|---|---|---|---|
| - | Coef. | S.E | IRR | 95% CI for IRR | |
| LB | UB | ||||
| Intercept | -0.570 | 0.088 | 0.568*** | 0.477 | 0.672 |
| Age (ref=15-19) | |||||
| 20-29 | 1.287 | 0.085 | 3.620*** | 3.065 | 4.277 |
| 30-39 | 1.862 | 0.085 | 6.438*** | 5.451 | 7.604 |
| 40-49 | 2.109 | 0.086 | 8.240*** | 6.966 | 9.747 |
| Religion (ref=Muslim) | |||||
| Orthodox | -0.166 | 0.019 | 0.847*** | 0.817 | 0.879 |
| Others | -0.026 | 0.020 | 0.975 | 0.937 | 1.013 |
| Education level (ref=Educated) | |||||
| Uneducated | 0.156 | 0.020 | 1.168*** | 1.125 | 1.213 |
| Wealth index (ref=Middle) | |||||
| Poor | 0.054 | 0.020 | 1.056** | 1.014 | 1.099 |
| Rich | -0.045 | 0.024 | 0.956 | 0.913 | 1.001 |
| Family planning (ref=No) | |||||
| Yes | -0.040 | 0.018 | 0.961* | 0.927 | 0.997 |
| Marital status (ref=Married) | |||||
| Single | -0.292 | 0.026 | 0.747*** | 0.709 | 0.786 |
| Age at 1st Birth (ref=Greater than 18) | |||||
| Less than or equal to 18 | 0.294 | 0.016 | 1.341*** | 1.299 | 1.385 |
| Mothers who have experienced the death of a child (ref=No) | |||||
| Yes | 0.277 | 0.016 | 1.319*** | 1.277 | 1.361 |
| Zero-inflated Part | |||||
| - | Coef. | S.E | AOR | 95% CI for IRR | |
| LB | UB | ||||
| Intercept | -18.299 | 561.405 | 1.13E-08 | 0 | Inf |
| Age (ref=15-19) | |||||
| 20-29 | -0.998 | 0.199 | 0.369*** | 0.250 | 0.545 |
| 30-39 | -2.598 | 0.277 | 0.074*** | 0.043 | 0.128 |
| 40-49 | -2.920 | 0.373 | 0.054*** | 0.026 | 0.112 |
| Religion (ref=Muslim) | |||||
| Orthodox | -0.130 | 0.187 | 0.879 | 0.609 | 1.268 |
| Others | -0.455 | 0.188 | 0.634* | 0.439 | 0.917 |
| Education level (ref=Educated) | |||||
| Uneducated | -0.799 | 0.163 | 0.450*** | 0.326 | 0.619 |
| Wealth index (ref=Middle) | |||||
| Poor | -0.487 | 0.197 | 0.615* | 0.418 | 0.905 |
| Rich | -0.110 | 0.218 | 0.896 | 0.583 | 1.376 |
| Family planning (ref=No) | |||||
| Yes | -1.893 | 0.326 | 0.152*** | 0.080 | 0.285 |
| Marital status (ref=Married) | |||||
| Single | 2.859 | 0.154 | 17.437*** | 12.889 | 23.589 |
| Age at 1st Birth (ref=Greater than 18) | |||||
| Less than or equal to 18 | 18.518 | 561.405 | 110261632 | 0 | Inf |
| Mothers who have a dead child (ref=No) | |||||
| Yes | -18.397 | 820.483 | 0.00000001 | 0 | Inf |
Note: “*” significance at 5%, “**” significance at 1%, “***” significance at 0.1%.
The table presents both the Poisson and zero-inflated parts. The Poisson part models the expected number of children ever-born from women of reproductive age, while the zero-inflated part models the probability that a woman will have no children at all (structural zeros) versus having children. The analysis revealed that each predictor variable was statistically significant concerning the total number of children ever born, as demonstrated by the model's inflated Poisson segment. The estimated average number of children ever born for women aged 20-29, 30-39, and 40-49 years was 3.620 (IRR = 3.620; 95% CI: 3.065, 4.277), 6.438 (IRR = 6.438; 95% CI: 5.451, 7.604), and 8.240 (IRR = 8.240; 95% CI: 6.966, 9.747), respectively, which is higher compared to women aged 15-19 years. For Orthodox women, the estimated average number of children ever born was 0.847 times lower (IRR = 0.847; 95% CI: 0.817, 0.879) than that of Muslim women. In comparison to married women, single women had an estimated average number of children ever born that was 0.747 (IRR = 0.747; 95% CI: 0.709, 0.786) times lower.
Women without formal education had an estimated mean number of children ever born that was 1.168 times greater (IRR = 1.168; 95% CI: 1.125, 1.213) than that of educated women. Similarly, women from poorer economic backgrounds had an estimated mean number of children ever born that was 1.056 times higher (IRR = 1.056; 95% CI: 1.014, 1.099) than those with a medium wealth index. For women who had experienced the loss of a child, the estimated mean number of children ever born was 1.319 times higher (IRR = 1.319; 95% CI: 1.277, 1.361) than for those who had not faced such a loss. Women who used family planning methods had an estimated mean number of children ever born that was 0.961 times lower (IRR = 0.961; 95% CI: 0.927, 0.997) compared to those who did not use these methods. Additionally, women who had their first child before turning 18 had an estimated mean number of children ever born that was 1.341 times higher (IRR = 1.341; 95% CI: 1.299, 1.385) than those who gave birth for the first time after the age of 18.
Moreover, the zero-inflated component of the analysis reveals that factors such as educational level, wealth index, age of women, family planning methods, marital status, and religious affiliation are statistically significant predictors of the total number of children ever born to rural women in the country. The probability of having no children was reduced by 63.1%, 92.6%, and 94.6% among women aged 20-29 years (AOR = 0.369; 95% CI: 0.250, 0.545), 30-39 years (AOR = 0.074; 95% CI: 0.043, 0.128), and 40-49 years (AOR = 0.054; 95% CI: 0.026, 0.112), respectively, when compared to women aged 15-19 years. Additionally, educational attainment impacted the number of children ever born. Women with no formal education were 55% less likely to have no children compared to those with formal education (AOR = 0.450; 95% CI: 0.326, 0.619). Women from economically disadvantaged backgrounds were 38.5% less likely to have no children than those from families with moderate wealth (AOR = 0.615; 95% CI: 0.418, 0.905). Furthermore, women who practiced family planning had an 84.8% lower likelihood of having no children compared to those who did not use such methods (AOR = 0.152; 95% CI: 0.080, 0.285). In contrast, single women were 17.437 times more likely to remain childless than their married counterparts (AOR = 17.437; 95% CI: 12.889, 23.589).
4. DISCUSSION
The dynamics of a country's population are significantly affected by the total number of children ever born, which acts as a primary determinant. This element is essential in determining the population's size, structure, and composition. In Ethiopia, the spatial distribution of the total number of children ever born showed a distinct clustering pattern, suggesting a positive spatial autocorrelation across various zones within the nation. This study's finding aligns with research conducted in Ethiopia and Nigeria [23, 31, 56]. The similarity in knowledge about reproductive health care and family planning among rural women may have contributed to this outcome.
Additionally, this study revealed that the Aris, Bale, Fik, West Harerge, Jigjiga, Dire Diwa, and Hundene zones were significant hotspots with a high average number of children ever born per woman in Ethiopia. In contrast, the significant cold spot zones with a low average number of total children ever born per woman were identified in North Wello, South Wello, South Gonder, Bahir Dar, Kefa, Godere, Kamashi, West Shewa, East Wellega, West Wellega, Illubabur, Sheka, Bench Maji, and Wagi Himra. A possible reason for this difference could be variation in socio-demographic, socio-economic, religious, and obstetric factors among the study participants.
The total number of children a person has can be affected by numerous factors, which are categorized as socio-demographic, socio-economic, and family planning-related factors. This study utilized a ZIP regression model to evaluate variables such as educational attainment, respondents' current age, family planning usage, marital status, mothers who have lost a child, age at first childbirth, religion, and wealth index. The results indicate that these predictor variables, such as educational level, women's current age, marital status, family planning usage, mothers who have experienced child loss, age at first childbirth, religion, and wealth index, significantly impacted the total number of children ever born in the country. The findings of this study indicate that the religious affiliation of women has a notable impact on the overall number of children they bear in Ethiopia. Specifically, women belonging to the Orthodox faith were found to have a lower likelihood of having a higher number of children compared to their Muslim counterparts. These findings align with those of studies conducted in Ethiopia, Nigeria, Ghana, and Bangladesh [1, 14, 16, 19, 23, 33, 34, 56, 57].
Our study revealed a direct relationship between women's age and the total number of children they had given birth to. Specifically, women aged 20-29, 30-39, and 40-49 exhibit a significantly higher number of children ever born than women aged 15-19. This result is in line with previous studies conducted in Ethiopia and other countries [15-17, 21, 22, 34, 56]. This finding was anticipated, as older women have spent more years in their childbearing age groups. Moreover, older women tend to lean towards conservatism and tradition, choosing to have a larger number of children and refraining from utilizing methods to avoid pregnancy.
The outcome of this study showed that the number of children ever born among single women is lower than among married women. This result is similar to those of studies conducted in Ghana, Botswana, and Nigeria [13, 19, 23]. This could be due to marriage being regarded as a key institution for building families in rural Ethiopia.
This study revealed that education significantly affects the number of children ever born per woman. The average number of children ever born to women with no formal education was higher than that of women with formal education. This finding is consistent with previous research conducted in Ethiopia, Bangladesh, Ghana, Nigeria, Kenya, Botswana, Uganda, and Malawi [13-23, 31, 34], but differs from a previous study conducted in Ethiopia [33]. When rural women receive formal education, they are likely to have adequate knowledge of reproductive health and the utilization of family planning methods.
The rise in women's wealth index is associated with a reduction in the average number of children born to each woman. Women with lower wealth tend to have more children than those with moderate wealth, whereas women with higher wealth tend to have fewer children than those with moderate wealth. This result is consistent with studies conducted in Ethiopia and other countries [15, 17, 19-23, 33, 34]. Wealthy women may have easier access to reproductive healthcare and family planning services because of their financial resources.
Family planning methods are employed to reduce the total number of children born to rural women in Ethiopia. This finding is consistent with research conducted in Ethiopia, Nigeria, and Uganda [14, 18, 23, 32, 58, 59]. The reason for this could be the utilization of contraception methods to avoid unplanned pregnancies among women of reproductive age. Additionally, these methods were employed to determine the spacing between childbirths.
The study's findings indicated that women who have encountered child mortality tend to have a higher reported number of children ever born. Similar findings have been reported in other studies [20, 21]. One potential rationale is the concept of “insurance” fertility, where parents may have more children than they originally desire to guarantee that they will have offspring in case some do not survive. Furthermore, this correlation can be explained by the child replacement hypothesis, which suggests that the loss of a child prompts many couples to have another child to fill the void left by the deceased child. The research results suggest that women who gave birth to their first child before the age of 18 were more inclined to have a greater number of children overall, with similar findings observed in prior studies [13, 14, 16, 21, 31, 32, 34, 56]. It is possible that women who give birth before age 18 may have a longer period of fertility and a higher number of children ever born. This study aims to assess the spatial distribution of children ever born, which will help to inform and improve access to reproductive healthcare services, enhance education on contraceptive methods, and tackle the social and cultural influences affecting reproductive choices in rural Ethiopia. Moreover, this initiative is crucial for empowering women and offering them support, allowing them to make informed decisions that could lead to a reduction in the total number of children born. Consequently, this will positively influence reproductive health outcomes in rural Ethiopia. Since this study utilized the 2019 mini-EDHS data, the findings might not accurately reflect the current situation in Ethiopia. Additionally, important factors such as the cultural, behavioural, and other health-related aspects of the participants were not included in the datasets. Although we explored various potential determinants of the number of children ever born, there is a possibility that other unrecognized or unidentified factors may have been overlooked. Although the 2019 mini-DHS remains the most recent nationally representative dataset available, it may not fully reflect the current population dynamics of the country.
CONCLUSION
Ethiopia's fertility rate remains notably higher than the global average. In rural regions of Ethiopia, the distribution of the total number of children born shows a clustered spatial pattern. Specifically, the Arsi, Warder, Bale, Fik/Fiq, Shinile, West Harerge, Jigjiga, Dire Diwa, and Hundene zones reported a higher number of children ever born. Key factors influencing the total number of children include women's educational level, age, marital status, experience of child loss, age at first childbirth, religion, family planning, and wealth index. Empowering rural women by improving their access to economic and educational resources could potentially reduce the number of children they have. The study also proposes the development of targeted strategies for high-risk areas to address the specific reproductive needs of women. Based on the study's findings, authorities should prioritize implementing customized interventions and strategies in zones with elevated risk levels to cater to the distinct reproductive needs of women.
AUTHORS’ CONTRIBUTIONS
The authors confirm contribution to the paper as follows: A.N.T., M.T.E., and D.B.B.: Proposed the first draft, conducted data analysis and interpretation, and wrote the manuscript; N.N.R. and D.C.: were involved in critically revising and reviewing the whole manuscript. Finally, all authors have read and approved the final manuscript.
LIST OF ABBREVIATIONS
| EMDHS | = Ethiopian Mini Demographic and Health Survey |
| CSA | = Central Statistical Agency |
| EAs | = Enumeration Areas |
| AIC | = Akaike Information Criteria |
| BIC | = Bayesian Information Criteria |
| AOR | = Adjusted Odds Ratio |
| IRR | = Incidence Rate Ratio |
| NB | = Negative Binomial |
| ZIP | = Zero Inflated Poisson |
| ZINB | = Zero Inflated Negative Binomial |
| PHC | = Population and Housing Census |
ETHICAL STATEMENT
This study is based on the Demographic and Health Survey (DHS) data, and the DHS Program maintains strict standards for protecting the privacy of respondents and household members in all DHS surveys. The procedures and questionnaires for standard DHS surveys were reviewed and approved by the International Coaching Federation (ICF) Institutional Review Board (IRB). Additionally, country-specific DHS survey protocols are reviewed by the ICF IRB and, typically, by an IRB in the host country. Demographic and health surveys in each country have common standards, and detailed information about the ethical considerations can be found at https://www.dhsprogram.com/methodology/Protecting-the-Privacy-of-DHS-Survey-Respondents.cfm. This study is based on Ethiopian Demographic and Health Survey (EDHS) data, which was collected by the Central Ethiopian Agency, a country-specific IRB.
AVAILABILITY OF DATA AND MATERIALS
The data used in this study were sourced from the DHS website at https://www.dhsprogram.com/data/dataset _admin/login_main.cfm. To access the data, users must first register on the website and then provide a research project title along with a description of the analysis they plan to carry out using the data.
ACKNOWLEDGEMENTS
The authors are grateful to the Ethiopian Demographic and Health Survey for data availability. The authors would like to thank the South African National Research Foundation (NRF) and South African Medical Research Council (SAMRC) (South Africa DSTNRF-SAMRC SARCHI Research Chair in Biostatistics, Grant number 114613), which partially supported this research. Opinions expressed and conclusions arrived are those of the author and are not necessarily to be attributed to the NRF and SAMRC.

