All published articles of this journal are available on ScienceDirect.

Population Health in Uzbekistan: Emerging Public Health Trends and Widening Regional Disparities
Authors Info & Affiliations
Abstract
Introduction
Regional disparities in population health constitute a pressing public health challenge, particularly in developing and transitional economies. In Uzbekistan, systematic evaluations of health inequalities at the subnational level remain constrained by the paucity of composite analytical frameworks. This study assesses spatial and temporal variations in population health across Uzbekistan employing a composite Public Health Index (PHI).
Methods
A longitudinal ecological analysis encompassing all 14 administrative regions of Uzbekistan from 2010 to 2023 was conducted. The PHI integrated three principal indicators: life expectancy at birth, infant mortality rate, and access to healthcare services. Data were obtained from the Statistical Agency under the President of the Republic of Uzbekistan. Indicators underwent min-max normalization, equal weighting, and aggregation to derive annual PHI scores and the long-term Average Public Health Index (APHI). Spatial autocorrelation and visualization were performed using ArcGIS 10.8 to delineate regional patterns.
Results
Pronounced and persistent inter-regional disparities have emerged. APHI scores spanned 6.73 (Tashkent City) to 13.87 (Fergana), with Samarkand registering 13.00. Regions burdened by elevated environmental stressors and constrained healthcare access consistently exhibited suboptimal PHI values. Spatial analysis revealed a marked east-west gradient, underscored by significant clustering of high- and low-performing regions.
Discussion
Findings elucidate the interplay of environmental, healthcare access, and socioeconomic determinants in perpetuating health inequities. Although the PHI affords transparency and efficacy, its omission of income disparities and direct environmental exposures represents a methodological limitation.
Conclusion
The PHI provides a robust, policy-oriented instrument for surveilling regional health disparities in Uzbekistan, informing evidence-based planning and equitable resource distribution.
1. INTRODUCTION
Population health is widely recognized as a core indicator of national development, social well-being, and economic productivity. Contemporary frameworks emphasize that health outcomes are shaped not only by clinical factors but also by broader social and environmental determinants such as education, income, and ecological conditions [1, 2]. This shift reflects global efforts, including the SDG 3 agenda to adopt more integrated and measurable approaches for monitoring population health [3].
Theoretical perspectives-from the WHO’s holistic definition of health to the Social Determinants of Health model and Grossman’s health-capital theory-highlight that health functions both as an individual capability and as a driver of societal progress. These frameworks underscore the need for composite metrics that can capture the multidimensional nature of health in a practical and comparable way [4-6].
Across many countries, including those in Central Asia, regional disparities in health outcomes remain persistent due to uneven economic development, environmental pressures, and differences in healthcare access. In Uzbekistan, recent studies have reported variations in respiratory, cardiovascular, and non-communicable disease burdens, particularly in industrial regions such as Navoi and Zarafshan. Urban–rural gaps in healthcare infrastructure and environmental risks further widen these inequalities [7-9].
However, despite the availability of national health statistics, Uzbekistan currently lacks a composite, region-level index that allows systematic comparison of public health conditions over time [10-13]. This gap limits the ability of policymakers to identify vulnerable regions, evaluate interventions, and design evidence-based strategies (Fig. 1).
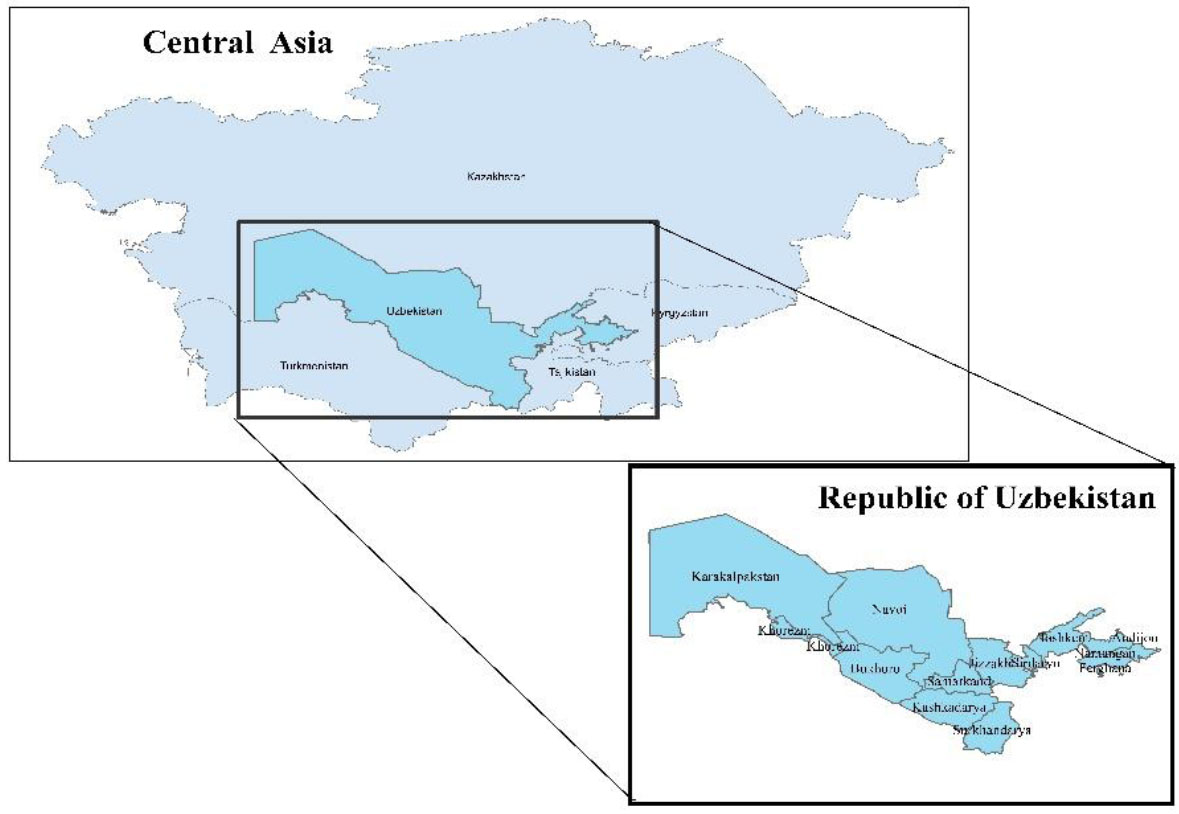
Study area of the research.
Therefore, this study applies the Public Health Index (PHI) framework to assess regional health disparities across Uzbekistan from 2010 to 2023. By integrating key indicators-life expectancy, infant mortality, and access to healthcare-this research provides a standardized tool for comparing regions and monitoring long-term trends.
The study contributes by filling the national methodological gap, offering the first PHI-based regional assessment for Uzbekistan, and demonstrating its relevance for future health planning and policy formulation.
2. METHODOLOGY
This study develops a composite Public Health Index (PHI) to evaluate regional health disparities across Uzbekistan from 2010 to 2023. The methodological approach follows established guidelines for composite index construction (OECD, 2008; WHO, 2015) [14-16], including indicator selection, normalization, weighting, aggregation, and spatial visualization.
2.1. Indicator Selection and Justification
Three indicators were selected based on their international comparability, availability in Uzbekistan’s national statistics, and relevance to core dimensions of population health:
- Life Expectancy (LE) – captures overall population longevity.
- Infant Mortality Rate (IMR) – a globally recognized proxy for health system performance.
- Access to Healthcare Services (AHS) – reflects structural accessibility and service availability.
These indicators represent mortality, survival, and health system access-the minimum set required for a balanced and interpretable composite index. Similar three-component frameworks have been used in global health assessments and regional inequality studies [17, 18].
Equal weighting was applied because:
- All three indicators represent distinct but equally important dimensions;
- No empirical evidence supports differential weighting for Uzbekistan;
- Equal weights are recommended when building first-generation indices to avoid subjective bias.
2.2. Data Sources
Data were obtained from the Statistical Agency under the President of Uzbekistan for all 14 administrative regions (2010–2023). Only official, methodologically consistent datasets were included.
2.3. Data Quality Checks and Cleaning
A structured data-cleaning procedure was applied:
2.4. PHI Construction
Indicators were normalized using min–max scaling to ensure comparability (Eq. 1):
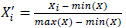 (1)
(1)
IMR was reverse-scaled (lower = better health) (Eq. 2):
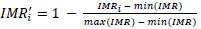 (2)
(2)
The Public Health Index for each region r and year t was calculated as (Eq. 3):
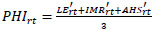 (3)
(3)
Regional averages (APHI) were computed across the 2010–2023 period.
2.5. Spatial Analysis
ArcGIS 10.8 was used to map PHI values and visualize regional disparities [19].
Key steps included:
- Spatial data preparation: attaching PHI values to the regional shapefile (UZB_admin1).
- Classification method: the maps used Natural Breaks (Jenks) to highlight real differences between high- and low-performing regions [20, 21].
- Visualization: regions were categorized into five PHI classes to ensure interpretability and comparability [22].
This GIS-based approach allows clear spatial interpretation of health inequalities across Uzbekistan.
3. RESULTS
3.1. Overview of Indicators Used in PHI Calculation
The Public Health Index (PHI) was calculated for all 14 administrative regions of Uzbekistan for the period 2010–2023 using Life Expectancy (LE) Infant Mortality Rate (IMR), and Access to Healthcare Services (AHS). Tables 1-3 summarize the annual values of these indicators. All data were obtained from the Statistical Agency under the President of the Republic of Uzbekistan.
| Regions | Years | |||||||||||||
|---|---|---|---|---|---|---|---|---|---|---|---|---|---|---|
| 2010 | 2011 | 2012 | 2013 | 2014 | 2015 | 2016 | 2017 | 2018 | 2019 | 2020 | 2021 | 2022 | 2023 | |
| Republic of Karakalpak | 70.4 | 71.1 | 71.4 | 71.9 | 72.2 | 72.6 | 72.7 | 72.7 | 73.2 | 74 | 72.5 | 73.5 | 72.9 | 72.7 |
| Andijan | 72 | 71.7 | 71.9 | 72.1 | 72.2 | 72.3 | 72.5 | 72.1 | 73.1 | 74.2 | 73.3 | 73.3 | 74.5 | 74.7 |
| Bukhara | 73.7 | 74 | 74.5 | 74.7 | 75 | 75 | 75.5 | 75.5 | 76.6 | 76.5 | 74 | 75.4 | 75.9 | 76.8 |
| Fergana | 72.8 | 72.9 | 73.2 | 73.6 | 73.6 | 73.8 | 74.5 | 74.3 | 75.4 | 75.6 | 74.5 | 74.8 | 75.4 | 75.7 |
| Namangan | 72.9 | 72.8 | 72.7 | 73.3 | 73.2 | 73.1 | 73.6 | 73.1 | 74.6 | 74.7 | 73.4 | 73.9 | 74.4 | 74.5 |
| Navoi | 73 | 73.1 | 73.2 | 73.6 | 73.7 | 74.3 | 73.9 | 74.1 | 75.8 | 75.5 | 73.7 | 74.4 | 76.8 | 76.1 |
| Jizzakh | 75.8 | 76.1 | 76.1 | 76 | 76 | 75.9 | 76.2 | 75.7 | 77.3 | 78 | 74.4 | 75.1 | 74.2 | 74.5 |
| Syrdarya | 70.1 | 70.3 | 70 | 70.4 | 70.5 | 70.7 | 70.3 | 70.6 | 71.7 | 71.9 | 72.1 | 72 | 71.8 | 71.7 |
| Surkhandarya | 74.3 | 73.9 | 74 | 74.1 | 74.1 | 74.4 | 74 | 73.2 | 74.4 | 75 | 73.3 | 72.9 | 72.2 | 72.8 |
| Tashkent | 71.7 | 72.1 | 72 | 72.4 | 72.4 | 72.7 | 73.1 | 73.3 | 74 | 74.7 | 72.4 | 72.7 | 75.5 | 75.4 |
| Khorezm | 72.6 | 72.8 | 72.3 | 73.3 | 72.7 | 72.9 | 72.8 | 72.9 | 73.6 | 73.5 | 72.2 | 72.7 | 73.2 | 74.3 |
| Kashkadarya | 74.8 | 74.4 | 74.7 | 75 | 74.3 | 74.8 | 74.5 | 74.2 | 74.8 | 75.6 | 74.4 | 73.9 | 72.6 | 73.3 |
| Samarkand | 72.7 | 73.4 | 73.4 | 73.5 | 73.7 | 73.7 | 74 | 74 | 74.8 | 75.2 | 73.4 | 73.6 | 73.7 | 74 |
| Tashkent city | 72.1 | 72.3 | 73.1 | 73.4 | 73.5 | 73.7 | 73.9 | 74.5 | 75.6 | 76.3 | 72.4 | 74.4 | 76 | 77.1 |
*Note: All primary statistical data were analyzed and processed using data from the Statistical Agency under the President of the Republic of Uzbekistan.
| Regions | Years | |||||||||||||
|---|---|---|---|---|---|---|---|---|---|---|---|---|---|---|
| 2010 | 2011 | 2012 | 2013 | 2014 | 2015 | 2016 | 2017 | 2018 | 2019 | 2020 | 2021 | 2022 | 2023 | |
| Republic of Karakalpak | 11.8 | 11.2 | 11.8 | 11.4 | 12.5 | 11.6 | 13.7 | 16.6 | 13.9 | 10.8 | 12.1 | 10.6 | 10.9 | 11.5 |
| Andijan | 9.4 | 9.2 | 11.9 | 12 | 12.5 | 14.2 | 14.3 | 15.7 | 14.5 | 12.2 | 12.8 | 12.5 | 8.8 | 9.9 |
| Bukhara | 11.3 | 10.2 | 10.6 | 9.7 | 10.2 | 10 | 9.5 | 9.5 | 7.4 | 7.7 | 7.5 | 7.6 | 7.2 | 7.2 |
| Fergana | 14.1 | 12.7 | 12.1 | 10 | 9.5 | 9.1 | 7.4 | 7.5 | 6 | 6 | 6.6 | 5.9 | 6.2 | 6 |
| Namangan | 12.5 | 12.5 | 11.9 | 11 | 11.4 | 12.2 | 9.9 | 14.3 | 12.1 | 10.2 | 10.6 | 10.6 | 7.7 | 9.5 |
| Navoi | 6.6 | 7.4 | 7.6 | 7.4 | 9.2 | 9.8 | 8.9 | 9.6 | 7 | 7.4 | 7.4 | 7.1 | 4.8 | 7.1 |
| Jizzakh | 8.8 | 8.8 | 8.1 | 7.1 | 10.6 | 9.9 | 11.1 | 13.7 | 9.8 | 11.4 | 8.7 | 9.1 | 8.7 | 5.3 |
| Syrdarya | 10.2 | 10.7 | 11.6 | 10.1 | 11.3 | 12.9 | 15.1 | 13.1 | 12.1 | 11.7 | 9.8 | 10.1 | 14.6 | 10 |
| Surkhandarya | 7.8 | 6.6 | 7.4 | 7.9 | 9.9 | 9.9 | 9 | 9.1 | 9.3 | 8.4 | 8.6 | 9.1 | 11.5 | 7.7 |
| Tashkent | 11 | 10.6 | 9.9 | 10.3 | 10.3 | 10.9 | 11 | 10.6 | 9.2 | 9.3 | 10.7 | 9 | 6.4 | 6.7 |
| Khorezm | 12 | 11.8 | 11.3 | 9.7 | 14.2 | 14.2 | 14.6 | 16.2 | 13 | 12.6 | 12.6 | 12.6 | 8.4 | 8.7 |
| Kashkadarya | 10.1 | 9.6 | 8.8 | 8.1 | 8.1 | 8.6 | 7.9 | 9 | 9 | 7.8 | 8 | 9.3 | 11.2 | 10 |
| Samarkand | 9.4 | 9 | 7.7 | 7.9 | 8.7 | 10.1 | 8 | 7.5 | 7.2 | 7.1 | 6.5 | 6.5 | 6.7 | 8.2 |
| Tashkent city | 17.1 | 15.6 | 13.1 | 14.5 | 16.9 | 19.9 | 17.8 | 17.1 | 12.8 | 12.6 | 12.2 | 11.5 | 11.1 | 11.5 |
*Note: All primary statistical data were analyzed and processed using data from the Statistical Agency under the President of the Republic of Uzbekistan.
| Regions | Years | |||||||||||||
|---|---|---|---|---|---|---|---|---|---|---|---|---|---|---|
| 2010 | 2011 | 2012 | 2013 | 2014 | 2015 | 2016 | 2017 | 2018 | 2019 | 2020 | 2021 | 2022 | 2023 | |
| Republic of Karakalpak | 13264.7 | 13594.6 | 13766.9 | 14422.7 | 15197.1 | 15118.4 | 15654.3 | 15665.4 | 15074 | 14968.8 | 12572.5 | 14072.1 | 13708.9 | 13559.5 |
| Andijan | 21848.7 | 22439.8 | 22826.1 | 22810.6 | 23322.4 | 25699.9 | 27076.8 | 29163.7 | 27761.0 | 27919.6 | 25052.6 | 26367.5 | 26987.4 | 25461.4 |
| Bukhara | 17611.7 | 18407.3 | 18386 | 18379.1 | 20225.7 | 20181.4 | 20446.6 | 20510.6 | 20498.9 | 19758.4 | 17493.5 | 18776.2 | 19077.4 | 18070.8 |
| Fergana | 29014.5 | 30093.8 | 31219.7 | 31585 | 34829.8 | 36480.1 | 38073.2 | 35941.6 | 36504.3 | 36673.9 | 26454.6 | 29071.2 | 29599.9 | 29712.3 |
| Namangan | 20872.2 | 21530.5 | 21947.3 | 21568.8 | 21581.6 | 21880.2 | 21456.3 | 18774.5 | 19159.5 | 20790.5 | 16520.4 | 17310.9 | 17868.0 | 18125.1 |
| Navoi | 9039.9 | 9015.4 | 8903.8 | 8871.6 | 9547 | 9083.3 | 9221.3 | 9360.3 | 9604.1 | 10026.6 | 8090.4 | 9604.8 | 9635.8 | 9601.2 |
| Jizzakh | 8761.1 | 9018 | 8228 | 9243.2 | 9651.5 | 9068.1 | 8821.6 | 7916.1 | 7614.3 | 7950.1 | 6811 | 7617.7 | 7713.9 | 7853.2 |
| Syrdarya | 6161.5 | 6342.1 | 6606.3 | 6749.5 | 7635.1 | 6672.7 | 6914.3 | 7434.4 | 7398 | 7994.3 | 5661.1 | 7112.6 | 5351.2 | 5578.6 |
| Surkhandarya | 16051.5 | 15729.5 | 15926.8 | 18013.1 | 17260.1 | 16899.3 | 17330.9 | 17251.7 | 15645 | 17027.3 | 16688.3 | 17031.2 | 16761.7 | 18143.0 |
| Tashkent | 23348 | 23373.6 | 23555.6 | 22418.9 | 24703 | 25437 | 25236.1 | 17494.8 | 21052.3 | 21402.7 | 17270.1 | 20192.6 | 18365.4 | 18296.3 |
| Khorezm | 15478.9 | 19885 | 20112 | 19925.8 | 20399.4 | 20333.3 | 21156.8 | 19273.4 | 18540.6 | 17927.9 | 15241.8 | 16877.6 | 16509.7 | 15758.7 |
| Kashkadarya | 23476.8 | 23951.9 | 23352 | 23028.8 | 40012 | 38045.1 | 37519.8 | 33389.7 | 31344.3 | 33029.9 | 28351.3 | 25595.1 | 26282.7 | 26936.3 |
| Samarkand | 27772.8 | 27767.3 | 27983.2 | 28141 | 31501 | 32271.1 | 33769.9 | 31194.2 | 27264.2 | 29455.7 | 21776.7 | 20723.6 | 23962.8 | 25453.2 |
| Tashkent city | 34032.1 | 34107.7 | 35279.1 | 32979.1 | 37319.2 | 38523.9 | 40546.3 | 41382 | 40379.4 | 41386.9 | 32113.1 | 35224.7 | 6143.5 | 55624.9 |
*Note: All primary statistical data were analyzed and processed using data from the Statistical Agency under the President of the Republic of Uzbekistan.
3.2. Regional Patterns in Component Indicators (2010–2023)
3.2.1. Life Expectancy (LE)
Across Uzbekistan, LE showed a gradual increasing trend. By synthesizing regional averages over the 14-year period (Table 1):
- The highest mean LE was recorded in Jizzakh, Bukhara and Fergana regions.
- The lowest mean LE was observed in Syrdarya, Karakalpakstan and Tashkent City.
3.2.2. Infant Mortality Rate (IMR)
IMR generally declined nationwide between 2010 and 2023. Summary patterns show the Table 2:
- Lowest average IMR levels in Fergana, Bukhara, and Samarkand.
- Highest average IMR levels in Karakalpakstan, Khorezm and Tashkent City.
3.2.3. Access to Healthcare Services (AHS)
AHS values varied substantially among regions (Table 3). Overall: Tashkent City, Fergana, and Andijan had the highest total AHS volume. Syrdarya. Jizzakh and Navoi recorded the lowest AHS totals.
3.3. Public Health Index (PHI) Variability (2010–2023)
This study employs the Public Health Index (PHI) as a composite measure incorporating multiple health indicators to provide a comprehensive assessment of the population's health status (Fig. 2). The PHI is calculated using the following formula in Eq. (4):
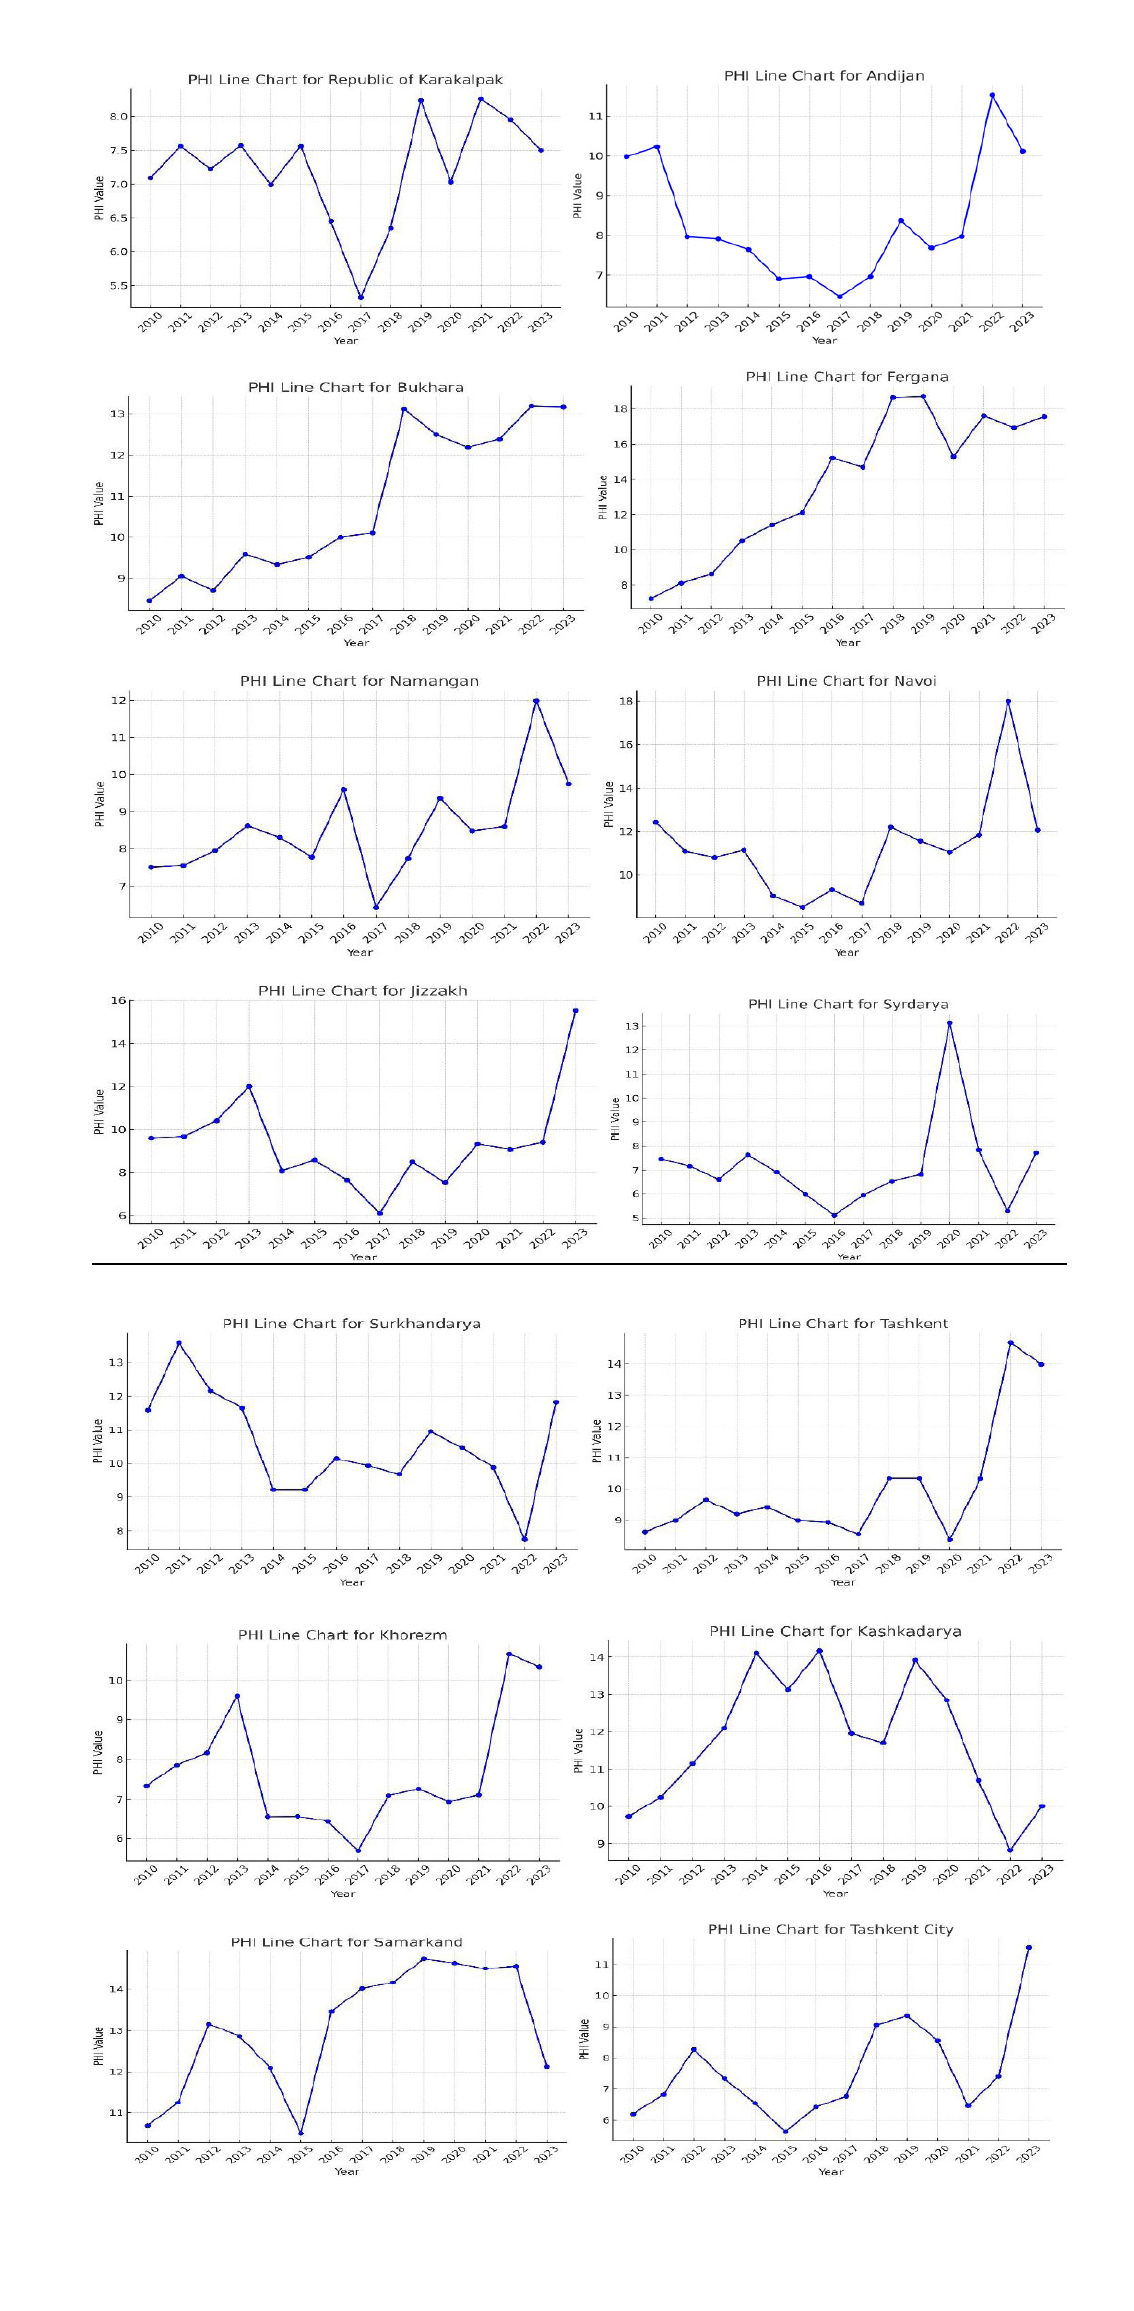
PHI index value by the regions in 2010-2023 years.
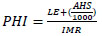 (4)
(4)
Across the 14-year period:
- PHI ranged from 6.2 to 14.5, demonstrating substantial regional variability (Fig. 3).
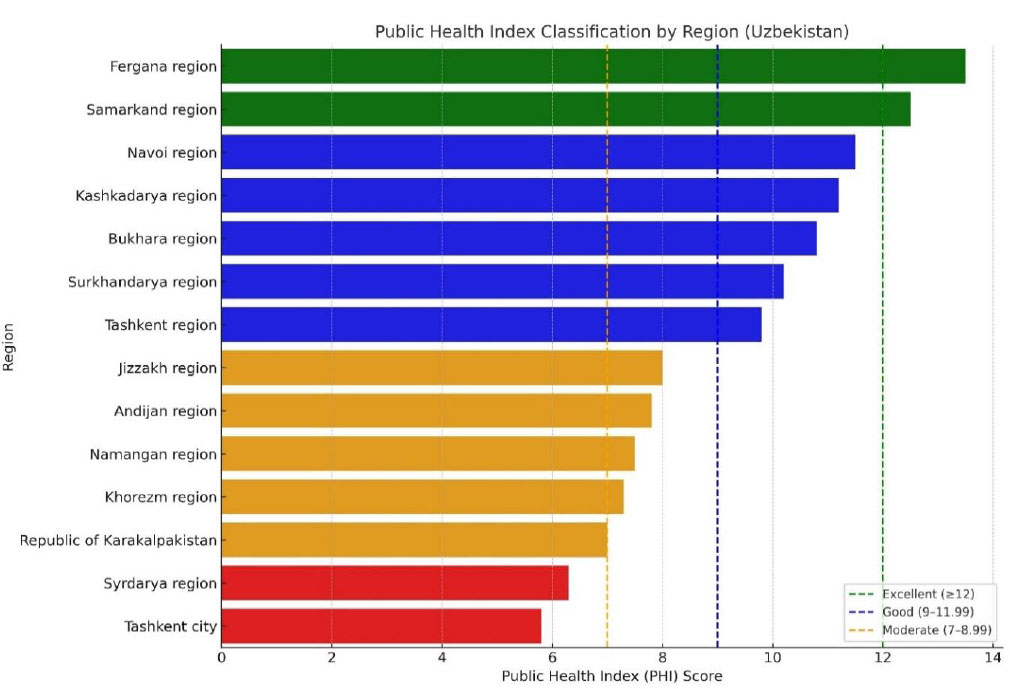 Fig. (3).
Public health index classification by regions.
- Regions generally fell into four classification groups: poor (<7), moderate (7–8.99), good (9–11.99), and excellent (≥12) (Table 4).
Table 4.Average public health index (APHI) rate classification.
Classification Name Classifier Indicator Excellent PHI ≥ 12 Good PHI 9 - 11.99 Moderate PHI 7 - 8.99 Poor PHI < 7
3.4. Average Public Health Index (APHI) by Region
Mean PHI values for 2010–2023 were computed to identify long-term public health levels. Table 5 presents the APHI values and classification categories.
| Region | APHI Score | Classification |
|---|---|---|
| Tashkent City | 6.73 | Poor |
| Syrdarya Region | 7.09 | Moderate |
| Republic of Karakalpakstan | 7.32 | Moderate |
| Khorezm Region | 7.79 | Moderate |
| Namangan Region | 8.57 | Moderate |
| Andijan Region | 8.73 | Moderate |
| Jizzakh Region | 9.87 | Good |
| Tashkent Region | 10.00 | Good |
| Surkhandarya Region | 10.41 | Good |
| Bukhara Region | 11.11 | Good |
| Kashkadarya Region | 11.72 | Good |
| Navoi Region | 11.84 | Good |
| Samarkand Region | 13.00 | Excellent |
| Fergana Region | 13.87 | Excellent |
In summary:
A 14-year analysis of PHI values across Uzbekistan's administrative units was conducted to determine regional health trends. The next phase involved grouping these indicators into qualitative classifications based on regional averages (Table 5). The Average Public Health Index (APHI) for each region was calculated as follows in Eq. (5):
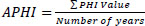 (5)
(5)
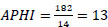
APHI index for the Republic of Karakalpakistan (Eq. 6):
 (6)
(6)
APHI index for Andijan region (Eq. 7):
 (7)
(7)
APHI index for Bukhara region (Eq. 8):
 (8)
(8)
APHI index for Fergana region (Eq. 9):
 (9)
(9)
APHI index for Namangan region (Eq. 10):
 (10)
(10)
APHI index for Navoi region (Eq. 11):
 (11)
(11)
APHI index for Jizzakh region (Eq. 12):
 (12)
(12)
APHI index for Syrdarya region (Eq. 13):
 (13)
(13)
APHI index for Surkhandarya region (Eq. 14):
 (14)
(14)
APHI index for Tashkent region (Eq. 15):
 (15)
(15)
APHI index for Khorezm region (Eq. 16):
 (16)
(16)
APHI index for Kashkadarya region (Eq. 17):
 (17)
(17)
APHI index for Samarkand region (Eq. 18):
 (18)
(18)
APHI index for Tashkent city (Eq. 19):
 (19)
(19)
3.5. Spatial Clustering of APHI Values
The spatial representation of APHI (Fig. 4) in ArcGIS 10.8 shows clear geographic grouping patterns. Regions were assigned color-coded classes based on the APHI scale:
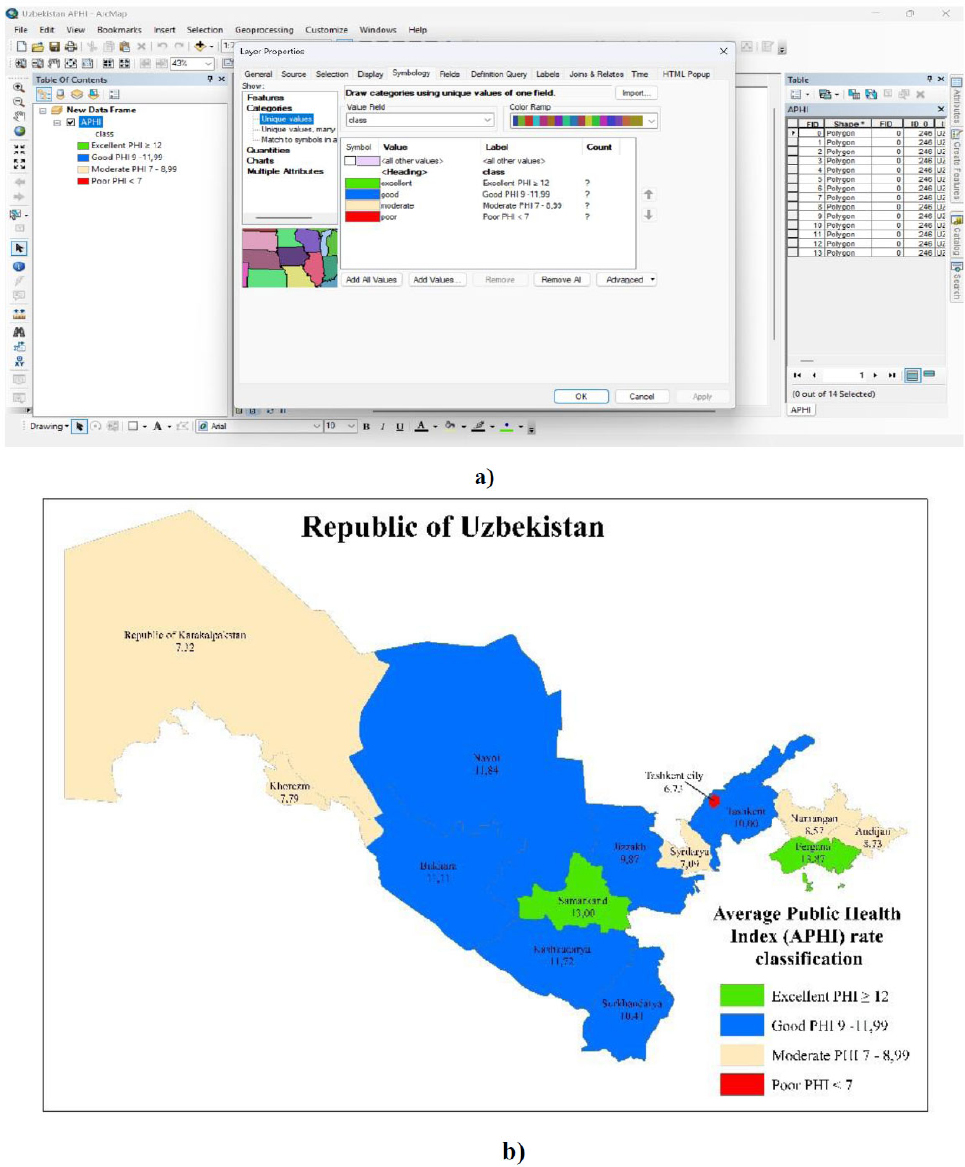
Data panel (a) and APHI mapping of Uzbekistan (b) using ArcGIS 10.8.
-
 Green (Excellent, APHI ≥ 12): Only two regions, Samarkand (13.00) and Fergana (13.87), fall into this category, indicating the most favorable public health conditions.
-
 Blue (Good, APHI 9 - 11.99): A substantial portion of the country falls within this range, including Navoi (11.84), Bukhara (11.11), Kashkadarya (11.72), Jizzakh (9.87), Surkhandarya (10.41), and Tashkent (10.00). These regions maintain relatively good health conditions, though they do not reach the highest level.
-
 Beige (Moderate, APHI 7 - 8.99): The Republic of Karakalpakstan (7.32), Khorezm (7.79), Namangan (8.57), Andijan (8.73), and Syrdarya (7.09) exhibit moderate health conditions, as reflected in their lower APHI values.
-
 Red (Poor, APHI < 7): Tashkent City (6.73) is the only region classified under this category, indicating significant public health challenges.
These spatial patterns provide a descriptive overview of regional public health conditions; interpretation of underlying causes is presented in the Discussion section.
4. DISCUSSION
4.1. Key Findings
This study identified clear regional disparities in public health across Uzbekistan between 2010 and 2023. Fergana and Samarkand showed the highest APHI values. indicating consistently favorable health conditions, while Tashkent City, Karakalpakstan, Syrdarya, and Khorezm exhibited the lowest long-term scores. Spatial clustering revealed a distinct east–west gradient: eastern and central regions tended to perform better. whereas western and northwestern regions remained persistently below the national average. The PHI also demonstrated a steady national improvement over time. driven mainly by declining infant mortality.
4.2. Interpretation of Regional Patterns
The observed differences align with region-specific demographic and environmental profiles reported in national and international studies.
4.2.1. Western and Northwestern Regions
Western and northwestern regions - including Karakalpakstan and Khorezm-record lower APHI values. consistent with documented environmental stressors such as Aral Sea–related dust pollution. high respiratory disease prevalence. and limited access to specialized medical care (UNEP, 2022; WHO, 2020).
4.2.2. Central and Southern Regions
Central and southern regions (Samarkand, Bukhara, Kashkadarya, Navoi) benefit from relatively stable demographic structures and broader healthcare coverage. reflected in higher LE and lower IMR.
4.2.3. Eastern Regions
Eastern regions show internal variability: Fergana performs strongly across all indicators. In contrast, Andijan and Namangan remain moderate, mirroring earlier findings on the uneven distribution of medical resources within the Fergana Valley.
4.2.4. Tashkent City
Tashkent City has an extensive healthcare infrastructure and the lowest APHI due to high IMR and environmental pressures associated with traffic emissions, population density, and reduced green space availability-patterns consistent with recent urban health assessments in Central Asian capitals.
These interpretations are evidence-based, drawing on documented environmental and demographic characteristics rather than assumptions.
4.3. Comparison with Existing Literature
The findings align with earlier work indicating strong links between environmental quality, healthcare accessibility, and population health outcomes in Central Asia. Prior studies highlight elevated morbidity in western Uzbekistan linked to atmospheric pollution and water scarcity. The relatively higher performance of Samarkand and Fergana corresponds to research showing stronger primary healthcare networks and more favorable socio-economic profiles in these regions (MOH, 2021). International literature likewise supports the use of composite indices-such as PHI or HDI-based health measures-to capture multidimensional health differences across territories.
4.4. Strengths and Limitations
A key strength of this study is the use of a transparent composite index derived from three robust indicators with complete regional coverage over 14 years, allowing for consistent comparisons. The application of GIS visualization adds a spatial dimension that enhances interpretability.
However, the analysis is limited to indicators available in official datasets and does not incorporate additional determinants such as air-quality metrics, income distribution, or disease-specific morbidity rates. Equal weighting of indicators, while methodologically justified for transparency, may not fully capture the differential importance of LE, IMR, or AHS. Future research could test alternative weighting schemes or incorporate more granular environmental and socio-economic variables.
4.5. Policy Implications
The results point to several region-specific policy needs:
- Western regions (Karakalpakstan, Khorezm, Syrdarya): Policies should prioritize environmental remediation, expansion of primary healthcare facilities, and targeted maternal-child health programs, given persistently high IMR and lower LE.
- Tashkent City: Urban health interventions must focus on air-quality management, transport-related emissions, and green-infrastructure expansion as these environmental pressures align closely with the city’s low APHI.
- Moderate-performing eastern regions (Andijan, Namangan): Strengthening healthcare access and addressing internal resource disparities within the valley could reduce intra-regional inequality.
- High-performing regions (Fergana, Samarkand): Continued investment in preventive care and maintenance of current healthcare standards is essential to sustain gains.
The PHI provides a practical tool for monitoring regional progress and evaluating health policy effectiveness over time. Its use by national and regional authorities could support evidence-based planning aligned with the country’s public health reform agenda.
CONCLUSION
This study presents the first long-term, regionally comparable Public Health Index (PHI) for Uzbekistan, revealing clear and persistent spatial inequalities in population health. By combining life expectancy, infant mortality, and healthcare access, the PHI provides a practical and transparent tool for identifying priority regions and supporting evidence-based policy decisions. The findings highlight the need for targeted interventions in low-performing areas and demonstrate how composite indices can help guide more efficient allocation of health resources. Future research could expand this model with additional environmental and socio-economic indicators. However, the current PHI framework already establishes a significant foundation for regional health monitoring and strategic planning in Uzbekistan.
AUTHORS’ CONTRIBUTIONS
The authors confirm their contributions to the paper as follows: L.N.: Contributed to study conception and design; K.N.: Contributed to methodology; K.R.: Contributed to conceptualization; M.A. and M.G.: Handled visualization; K.M. and K.K.: Carried out data collection; and M.B.: Performed the analysis and interpretation of the results. All authors reviewed the results and approved the final version of the manuscript.
LIST OF ABBREVIATIONS
| PHI | = Public Health Index |
| APHI | = Average Public Health Index |
| LE | = Life Expectancy |
| IMR | = Infant Mortality Rate |
| AHS | = Access to Healthcare Services |
| SDG | = Sustainable Development Goals |
| QoL | = Quality of Life |
| NCD | = Non-Communicable Diseases |
| WHO | = World Health Organization |
AVAILABILITY OF DATA AND MATERIALS
The data supporting the findings of this article are available from the Statistics Agency under the President of the Republic of Uzbekistan at https://stat.uz and from the Ministry of Health of the Republic of Uzbekistan at https://ssv.uz. The processed dataset generated during the current study is available from the corresponding author [L.N] upon reasonable request.
FUNDING
This study did not receive specific funding from the public, commercial, or not-for-profit agencies. All analyses were conducted with institutional support from the National University of Uzbekistan named after Mirzo Ulugbek and Navoi State University.
ACKNOWLEDGEMENTS
The authors express their gratitude to the Department of Ecology, Environmental Protection, and Climate Change of the Navoi region and the National University of Uzbekistan named after Mirzo Ulugbek and Navoi State University, who closely assisted in the collection and analysis of this research material.

