All published articles of this journal are available on ScienceDirect.

Association Between Anthropometric Indices and Vitamin D Levels: Results From the Yazd Health Study
Authors Info & Affiliations
Abstract
Background
Obesity and overweight are widespread health problems affecting many populations. Some studies have shown an inverse association between obesity and vitamin D levels. This study aims to explore the connection between vitamin D levels and various body measurements in Iranian men and women.
Methods
This cross-sectional study used data from the Yazd Health Study. The final sample included 1116 men and women aged 20-70. We measured the following anthropometric indices: Body Mass Index (BMI), Waist-to-Hip Ratio, Waist-to-Height Ratio (WHR), conicity index, Body Roundness Index (BRI), body shape index, Abdominal Volume Index (AVI), Body Fat Percentage (BF%), Body Muscle Percentage (BM%), and visceral fat level. We fitted multiple linear regression models in three steps to adjust for confounders.
Results
In men, after adjusting for age, physical activity, hypertension, and diabetes mellitus, vitamin D deficiency showed a positive and nearly borderline significant association with WHtR (β = 0.027, 95% CI: 0.005; 0.048), BRI (β = 0.583, 95% CI: 0.136; 1.030), AVI (β = 1.761, 95% CI: 0.372; 3.150), and BF% (β = 3.614, 95% CI: 0.926; 6.303), and a negative association with BM% (β = -1.978, 95% CI: -3.655; -0.300). The associations of BRI and BF% with vitamin D deficiency remained borderline significant after further adjustment for other potential confounders. In women, vitamin D levels were not significantly associated with any of the anthropometric indices.
Discussion
Vitamin D levels differentially influence body composition across genders, highlighting potential sex-specific metabolic mechanisms of obesity and vitamin D status, and the need for targeted prevention and intervention strategies.
Conclusion
Vitamin D shows inverse associations with certain body indices in men, highlighting the importance of obesity vulnerability and the need for broader mechanistic studies.
1. INTRODUCTION
Obesity and overweight are global health challenges affecting over 2.5 billion people worldwide [1]. These conditions have increased rapidly in recent decades, leading to a worldwide epidemic [2]. Both obesity and overweight are linked to many chronic diseases, such as heart disease, Diabetes Mellitus (DM), and various cancers, which lead to significant illness and mortality [3].
Many individuals who are obese or overweight also suffer from low levels of micronutrients and vitamins, especially vitamin D [4, 5]. Vitamin D deficiency is a common problem in many countries, even in regions with sufficient sunlight, like Iran [6]. Vitamin D deficiency can cause or worsen various health problems and chronic diseases, including DM, autoimmune and inflammatory diseases, mental disorders, metabolic syndrome, and obesity [7, 8]. Previous studies have indicated an inverse association between obesity and vitamin D; however, the cause and mechanism of this association are still unclear [9, 10]. Several potential explanations exist, such as reduced availability of vitamin D due to its storage and increase in fat tissue [11], impaired vitamin D synthesis due to liver dysfunction [12], dilution of vitamin D in a larger fat mass [11], and stimulation of fat production in conditions of vitamin D deficiency [13].
Most studies examining the association between obesity and vitamin D have used only limited measures of body size and shape, such as Body Mass Index (BMI) and waist circumference. Few studies have included additional measures. Moreover, previous research in Iran has mainly focused on specific populations. In this study, we used a comprehensive range of both classic and new body size and shape measures to investigate the association between anthropometric indices and vitamin D levels in a cohort of Iranian adults aged 20 to 70 years.
2. MATERIAL AND METHODS
2.1. Study Design
This cross-sectional study used data from the enrollment phase of the Yazd Health Study (YaHS), a prospective cohort study investigating the incidence and risk factors of chronic illnesses in 9965 adults aged 20 to 70 years that has been conducted in the Yazd Greater Area since 2014. We used a cluster-random sampling method to select participants. They completed questionnaires, underwent anthropometric measurements, and provided blood samples for laboratory testing [14]. We excluded participants lacking vitamin D tests or anthropometric measurements, as well as those who were pregnant, had current cancer, Alzheimer's disease, a history of kidney stone surgery, or untreated DM. The final dataset included 1116 subjects aged 20 to 70 years. Details of the exclusions are shown in Fig. (1).
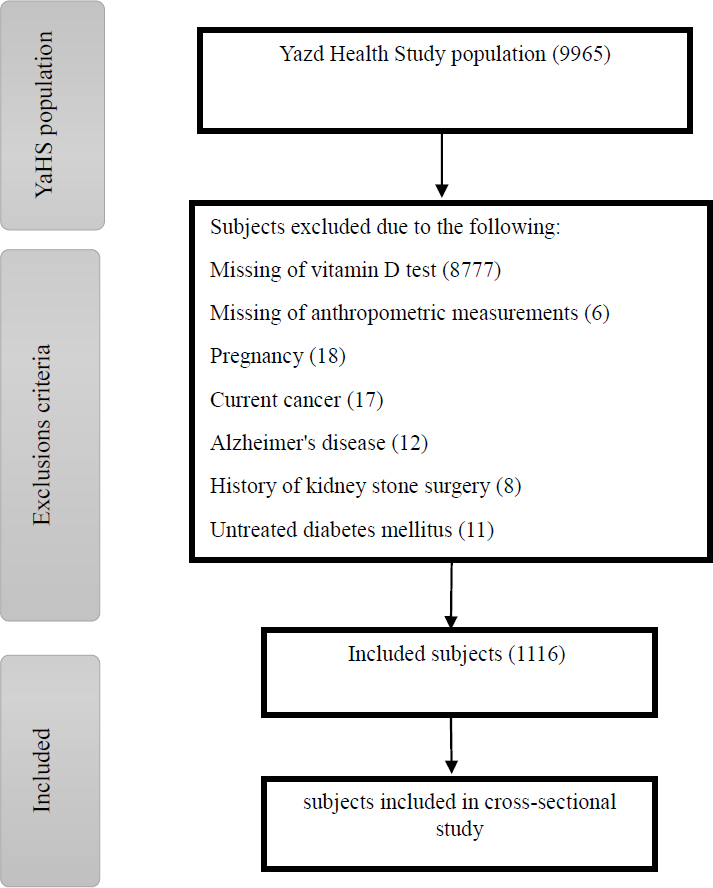
Details of the excluded participants of the study.
2.2. Anthropometry
Anthropometric measurements were conducted according to a standard protocol. Body weight was measured with minimal clothing, standing in the middle of the scale, and without assistance, with an accuracy of 0.1 kg using an Omron Model BF511 scale (Omron Inc., Nagoya, Japan). Body Fat Percentage (BF%), Body Muscle Percentage (BM%), and Visceral Fat Level (VFL) were also measured with the same device. Height was measured in a standing position, barefoot, and recorded to the nearest centimeter. BMI was calculated by dividing weight (kg) by the square of the height (m). Waist Circumference (WC) was recorded midway between the iliac crest and the lowest rib, and the Hip Circumference (HC) was measured around the largest circumference of the buttocks. These measurements were taken in a standing position using a non-stretch tape to the nearest 0.5 centimeter [14]. The Waist-to-Hip Ratio (WHR) and Waist-to-Height Ratio (WHtR) were calculated by dividing WC by HC and height, respectively.
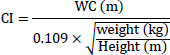
The Conicity Index (CI) is an accurate and efficient index for assessing visceral obesity [15]. It is based on the concept that, with the accumulation of fat in the abdominal region, the body changes to a double-cone shape with a common base. CI was computed by the following formula [16]:
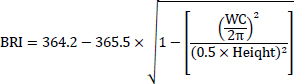
Body Roundness Index (BRI) was calculated by WC and height according to the formula [17]:
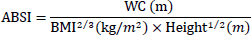
A Body Shape Index (ABSI) was computed according to the formula [18]:
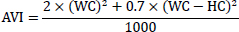
The Abdominal Volume Index (AVI) is a reliable index for estimating overall abdominal volume [19]. The formula computed AVI by WC (cm) and HC (cm):
2.3. Vitamin D Levels
Vitamin D test results were obtained from the Yazd central laboratory by linking the data with the YaHS participants' records. Serum 25-hydroxy vitamin D (25-OHD) levels were assessed using the vitamin D VIDAS Kit. This kit employs a direct competitive Enzyme-Linked Immunosorbent Assay (ELISA) method. The VIDAS 25-OHD total assay is suitable for measuring vitamins D2 and D3 serum levels with high accuracy [20]. Vitamin D levels were categorized as deficiency (< 20 ng/mL), insufficiency (20-29.9 ng/mL), and normal (≥ 30 ng/mL) [21].
2.4. Potential Confounding Variables
Physical activity was assessed using the International Physical Activity Questionnaire short form (IPAQ-SF) and categorized into three levels: low, moderate, and high [22]. DM, hypertension, thyroid disorders, and high cholesterol were defined based on the self-report presence or absence of these conditions. Participants were grouped into economic quartiles based on housing ownership status, house size (square meters), number of residents in the house, and number of trips per year. Additionally, variables such as age (continuous), smoking status (current, occasional, former, never), illicit drug use (yes, no), medication use in the past month (iron supplement, calcium supplement, vitamins, other supplements, none), marital status (married, single, widowed, divorced), and education level (primary school or less, high school, diploma and graduate diploma, graduation or higher) were considered as confounders.
2.5. Statistical Analysis
All statistical analyses were performed using SPSS software version 26.0 (SPSS Inc., Chicago, IL, USA) separately for men and women. Descriptive results were expressed as the numbers and percentages of participants for categorical variables and as mean ± Standard Deviation (SD) for continuous variables. Univariate generalized linear regression analysis was performed to assess the association between anthropometric indices and potential confounders. Variables showing significant associations were then included in multiple generalized linear regression models across three separate models to explore the association between anthropometric indices and vitamin D levels. All anthropometric indices were included as continuous dependent variables. Vitamin D levels functioned as the independent variable, with levels ≥ 30 ng/mL as the reference group. In model 1, age-adjusted regression coefficients and 95% Confidence Intervals (CI) were calculated. Model 2 was further adjusted for physical activity, DM, and hypertension. Model 3 included additional adjustments for thyroid disorders, high cholesterol, smoking status, illicit drug use, medication use in the last month, marital status, education, and economic quartiles. Variance Inflation Factors (VIFs) assessed multicollinearity among predictor variables. A power analysis for the overall test indicated high power (power = 0.97, total N = 1116, effect size = 0.163, α = 0.05). A P-value less than 0.05 was considered statistically significant.
3. RESULTS
3.1. Descriptive Statistics
A total of 1116 participants were included, of whom 76.8% were women. Participant characteristics are summarized in Table 1. The mean age was 43.88 years for women and 48.80 years for men. Women had higher rates of DM, thyroid problems, and high cholesterol compared to men. Smoking prevalence was 5.3% among women and 22% among men. Almost 86% of the participants were married. Vitamin D deficiency was more common in women (22.5%) than in men (20.1%), whereas vitamin D insufficiency was more prevalent among men (31.5%) compared to women (20.3%). The majority of participants had a BMI indicating an overweight status (25 ≤ BMI < 30), and women had a significantly higher BF% than men (39.54 and 25.94, respectively). Men exhibited higher mean values for WHR, CI, AVI, VFL, and BM%.
| Men (N=259) | Women (N=857) | p-value | |
|---|---|---|---|
| Age (years) | 48.8±13.6 | 43.8±13.7 | <0.01* |
| Physical activity (n (%)) | 0.089 | ||
| Low | 127 (49.0) | 476 (55.5) | |
| Moderate | 114 (44.0) | 360 (42.0) | |
| High | 14 (5.4) | 20 (2.3) | |
| Diabetes mellitus (n (%)) | <0.01* | ||
| Yes | 34 (13.1) | 119 (13.9) | |
| No | 220 (84.9) | 734 (85.6) | |
| Hypertension (n (%)) | <0.01* | ||
| Yes | 49 (18.9) | 156 (18.2) | |
| No | 205 (79.2) | 685 (79.9) | |
| Thyroid problems (n (%)) | 0.552 | ||
| Yes | 13 (5.0) | 166 (19.4) | |
| No | 240 (92.7) | 681 (79.5) | |
| High cholesterol (n (%)) | <0.01* | ||
| Yes | 43 (16.6) | 181 (21.1) | |
| No | 212 (81.9) | 664 (77.5) | |
| Smoking (n (%)) | 0.889 | ||
| Current | 32 (12.4) | 6 (0.7) | |
| Sometimes | 5 (1.9) | 5 (0.6) | |
| Former | 17 (6.6) | 5 (0.6) | |
| Never (<100) | 202 (78.0) | 812 (94.7) | |
| Drugs (n (%)) | 0.199 | ||
| Yes | 15 (5.8) | 19 (2.2) | |
| No | 239 (92.3) | 805 (93.9) | |
| Medication use in the last month (n (%)) | 0.303 | ||
| Iron supplement | 9 (3.5) | 95 (11.1) | |
| Calcium supplement | 12 (4.6) | 84 (9.8) | |
| Supplemental vitamins | 13 (5.0) | 30 (3.5) | |
| Other supplements | 4 (1.5) | 14 (1.6) | |
| No supplement | 210 (81.1) | 560 (65.3) | |
| Marriage status (n (%)) | 0.045* | ||
| Married | 239 (92.3) | 725 (84.6) | |
| Single | 18 (6.9) | 60 (7.0) | |
| Widowed | - | 61 (7.1) | |
| Divorced | - | 5 (0.6) | |
| Education (n (%)) | <0.01* | ||
| Primary school and less | 51 (19.7) | 246 (28.7) | |
| High school | 76 (29.3) | 243 (28.4) | |
| Diploma and graduate diploma | 90 (34.7) | 244 (28.5) | |
| Graduation or above | 40 (15.4) | 118 (13.8) | |
| Economic situation (n (%)) | <0.01* | ||
| Quartile 1 | 36 (13.9) | 143 (16.7) | |
| Quartile 2 | 72 (27.8) | 233 (27.2) | |
| Quartile 3 | 85 (32.8) | 261 (30.5) | |
| Quartile 4 | 61 (23.6) | 167 (19.5) | |
| Vitamin D levels (n (%)) | _ | ||
| Deficiency | 52 (20.1) | 193 (22.5) | |
| Insufficiency | 81 (31.3) | 174 (20.3) | |
| Normal | 126 (48.6) | 490 (57.2) | |
| Body mass index | 26.68±4.24 | 27.77±5.43 | <0.01* |
| Waist-to-hip ratio | 0.94±0.08 | 0.90±0.11 | 0.675 |
| Waist-to-height ratio | 0.56±0.06 | 0.59±0.09 | <0.01* |
| Conicity index | 1.30±0.09 | 1.29±0.13 | 0.031* |
| Body shape index | 0.08±0.00 | 0.08±0.00 | 0.153 |
| Body roundness index | 4.69±1.42 | 5.46±2.23 | <0.01* |
| Abdominal volume index | 18.63±4.30 | 17.97±5.34 | 0.022* |
| Body fat percentage | 25.94±8.36 | 39.54±8.05 | <0.01* |
| Body muscle percentage | 33.73±5.22 | 25.42±3.77 | 0.011* |
| Visceral fat level | 10.58±4.68 | 7.95±3.37 | <0.01* |
3.2. Anthropometry and Vitamin D in Men
The levels of vitamin D according to anthropometric indices in men are summarized in Table 2. Through multiple linear regression by adjusting age in model 1, WHtR (β = 0.026, 95% CI: 0.004; 0.047), BRI (β = 0.552, 95% CI: 0.106; 0.998), AVI (β = 1.799, 95% CI: 0.425; 3.172), and BF% (β = 2.831, 95% CI: 0.119; 5.543) showed a significant and positive association with vitamin D deficiency just in men. In model 2, these associations remained significant after the insertion of physical activity, hypertension, and DM. Moreover, the BM% showed a significant negative association with vitamin D deficiency in men (β = -1.978, 95% CI: -3.655; -0.300). In model 3, these associations were reduced, and the association in WHtR, AVI, and BM% disappeared after adjusting for other confounders. Model 3 for the association between anthropometric indices and vitamin D deficiency for BF% showed a 2.907% (95%CI: 0.095; 5.720) increase compared to BRI (β = 0.480, 95% CI: 0.011; 0.948) in men. The association of BMI, WHR, CI, ABSI, VFL, and BM% with vitamin D levels was not significant in men (Supplementary Material ). Model fit was assessed using the Akaike Information Criterion (AIC), with model 3 demonstrating the best balance between goodness-of-fit across all anthropometric indices.
| Measurements | Models |
Deficient vitamin D (< 20 ng/ml) |
Insufficient vitamin D (20-29.9 ng/ml) |
normal vitamin D (≥ 30 ng/ml) | AIC | ||
|---|---|---|---|---|---|---|---|
| β (95% CI) | P-value | β (95% CI) | p-value | ||||
| Body mass index | 1 | 1.139 (-0.225; 2.503) | 0.10 | -0.662(-1.840; 0.515) | 0.27 | 1 | 1486.71 |
| 2 | 1.152 (-0.239; 2.542) | 0.10 | -0.647(-1.851; 0.556) | 0.29 | 1405.20 | ||
| 3 | 0.740 (-0.720; 2.200) | 0.32 | -0.809(-2.102; 0.484) | 0.22 | 1258.87 | ||
| Waist-to-hip ratio | 1 | 0.022 (-0.004; 0.047) | 0.10 | 0.007 (-0.016; 0.029) | 0.56 | 1 | -569.68 |
| 2 | 0.018 (-0.007; 0.042) | 0.15 | 0.001 (-0.020; 0.022) | 0.94 | -571.30 | ||
| 3 | 0.014 (-0.012; 0.040) | 0.27 | -0.003(-0.026; 0.020) | 0.82 | -497.50 | ||
| Waist-to-height ratio | 1 | 0.026 (0.004; 0.047) * | 0.01* | -0.001(-0.019; 0.017) | 0.92 | 1 | -668.77 |
| 2 | 0.027 (0.005; 0.048) * | 0.01* | -0.001(-0.019; 0.018) | 0.93 | -641.97 | ||
| 3 | 0.022 (-0.001; 0.044) | 0.05 | -0.005 (-0.025; 0.014) | 0.60 | -564.10 | ||
| Conicity index | 1 | 0.030 (-0.001; 0.061) | 0.06 | 0.015 (-0.012; 0.042) | 0.27 | 1 | -469.71 |
| 2 | 0.030 (-0.002; 0.061) | 0.06 | 0.015 (-0.013; 0.042) | 0.29 | -453.43 | ||
| 3 | 0.028 (-0.004; 0.061) | 0.09 | 0.011 (-0.018; 0.040) | 0.46 | -399.77 | ||
| Body shape index | 1 | 0.001 (-0.001; 0.003) | 0.25 | 0.001 (0.000; 0.003) | 0.14 | 1 | -1892.61 |
| 2 | 0.001 (-0.001; 0.003) | 0.25 | 0.001 (0.000; 0.003) | 0.15 | -1796.83 | ||
| 3 | 0.001 (0.000; 0.003) | 0.23 | 0.001 (0.000; 0.003) | 0.24 | -1595.58 | ||
| Body roundness index | 1 | 0.552 (0.106; 0.998) * | 0.01* | -0.009(-0.394; 0.376) | 0.96 | 1 | 908.058 |
| 2 | 0.583 (0.136; 1.030) * | 0.01* | -0.004(-0.392; 0.383) | 0.98 | 849.686 | ||
| 3 | 0.480 (0.011; 0.948) * | 0.04 | -0.102(-0.517; 0.313) | 0.63 | 763.439 | ||
| Abdominal volume index | 1 | 1.799 (0.425; 3.172) * | 0.01* | -0.013(-1.198; 1.173) | 0.98 | 1 | 1490.43 |
| 2 | 1.761 (0.372; 3.150) * | 0.01* | -0.041(-1.243; 1.162) | 0.94 | 1404.83 | ||
| 3 | 1.411 (-0.045; 2.867) | 0.05 | -0.190(-1.480; 1.099) | 0.77 | 1257.61 | ||
| Body fat percentage | 1 | 2.831 (0.119; 5.543) * | 0.04* | -0.045(-2.370; 2.280) | 0.97 | 1 | 1816.39 |
| 2 | 3.614 (0.926; 6.303) * | 0.00* | 0.226 (-2.088; 2.539) | 0.84 | 1710.86 | ||
| 3 | 2.907 (0.095; 5.720) * | 0.04* | -0.037(-2.514; 2.441) | 0.98 | 1527.67 | ||
| Body muscle percentage | 1 | -1.484 (-3.165; 0.198) | 0.08 | -0.313(-1.760; 1.134) | 0.67 | 1 | 1565.60 |
| 2 | -1.978 (-3.655; -0.300) * | 0.02* | -0.448(-1.892; 0.995) | 0.54 | 1481.65 | ||
| 3 | -1.698 (-3.475; 0.079) | 0.06 | -0.456(-2.022; 1.109) | 0.56 | 1329.38 | ||
| Visceral fat level | 1 | 0.914 (-0.557; 2.384) | 0.22 | -0.918(-2.189; 0.353) | 0.15 | 1 | 1484.93 |
| 2 | 1.072 (-0.457; 2.600) | 0.16 | -0.886(-2.213; 0.440) | 0.19 | 1418.30 | ||
| 3 | 0.634 (-0.949; 2.216) | 0.43 | -1.118(-2.523; 0.287) | 0.11 | 1263.71 | ||
3.3. Anthropometry and Vitamin D in Women
Vitamin D levels in women according to anthropometric indices were summarized in Table 3. The association between these indices and vitamin D levels was not statistically significant across any models (Supplementary Material ). The study had adequate statistical power to detect differences between groups (power = 0.97).
| Measurements | Models |
Deficient vitamin D (< 20 ng/ml) |
Insufficient vitamin D (20-29.9 ng/ml) |
normal vitamin D (≥ 30 ng/ml) | AIC | ||
|---|---|---|---|---|---|---|---|
| β (95% CI) | P-value | β (95% CI) | p-value | ||||
| Body mass index | 1 | 0.193 (-0.695;1.080) | 0.67 | -0.174 (-1.060; 0.713) | 0.70 | 1 | 5220.78 |
| 2 | 0.256 (-0.633; 1.144) | 0.57 | -0.042 (-0.935; 0.851) | 0.92 | 5091.47 | ||
| 3 | 0.140 (-0.864; 1.145) | 0.78 | -0.598 (-1.647; 0.451) | 0.26 | 4074.34 | ||
| Waist-to-hip ratio | 1 | 0.007 (-0.013; 0.028) | 0.48 | -0.005 (-0.025; 0.015) | 0.63 | 1 | -1244.00 |
| 2 | 0.009 (-0.011; 0.030) | 0.37 | -0.004 (-0.024; 0.017) | 0.71 | -1225.69 | ||
| 3 | 0.001 (-0.021; 0.023) | 0.97 | -0.004 (-0.028; 0.019) | 0.81 | -975.65 | ||
| Waist-to-height ratio | 1 | 0.000 (-0.015; 0.014) | 0.98 | -0.003 (-0.018; 0.011) | 0.64 | 1 | -1824.74 |
| 2 | 0.002 (-0.012; 0.017) | 0.74 | -0.001 (-0.015; 0.013) | 0.88 | -1816.93 | ||
| 3 | -0.001 (-0.017; 0.015) | 0.90 | -0.005 (-0.022; 0.012) | 0.56 | -1397.38 | ||
| Conicity index | 1 | 0.001 (-0.021; 0.022) | 0.95 | 0.002 (-0.019; 0.023) | 0.84 | 1 | -1165.06 |
| 2 | 0.004 (-0.017; 0.025) | 0.69 | 0.004 (-0.017; 0.025) | 0.70 | -1177.01 | ||
| 3 | 0.004 (-0.020; 0.027) | 0.76 | 0.008 (-0.017; 0.032) | 0.53 | -899.15 | ||
| Body shape index | 1 | 6.26 (-0.001; 0.001) | 0.99 | 0.000 (-0.001; 0.002) | 0.63 | 1 | -5888.83 |
| 2 | 0.000 (-0.001; 0.002) | 0.77 | 0.000 (-0.001; 0.002) | 0.57 | -5780.86 | ||
| 3 | 0.000 (-0.001; 0.002) | 0.74 | 0.000 (-0.001; 0.002) | 0.29 | -4552.97 | ||
| Body roundness index | 1 | -0.046 (-0.389; 0.298) | 0.79 | -0.098 (-0.441; 0.245) | 0.57 | 1 | 3595.57 |
| 2 | 0.021 (-0.309; 0.351) | 0.90 | -0.032 (-0.364; 0.300) | 0.84 | 3434.12 | ||
| 3 | -0.064 (-0.439; 0.312) | 0.74 | -0.128 (-0.520; 0.264) | 0.52 | 2768.58 | ||
| Abdominal volume index | 1 | 0.052 (-0.801; 0.905) | 0.90 | -0.069 (-0.922; 0.783) | 0.87 | 1 | 5153.71 |
| 2 | 0.206 (-0.601; 1.014) | 0.61 | 0.109 (-0.703; 0.921) | 0.79 | 4932.09 | ||
| 3 | 0.143 (-0.779; 1.065) | 0.76 | -0.058 (-1.020; 0.904) | 0.90 | 3959.84 | ||
| Body fat percentage | 1 | 0.304 (-1.036; 1.644) | 0.65 | -0.377 (-1.715; 0.962) | 0.58 | 1 | 5920.03 |
| 2 | 0.300 (-1.036; 1.637) | 0.66 | -0.164 (-1.508; 1.181) | 0.81 | 5768.09 | ||
| 3 | 0.082 (-1.427; 1.592) | 0.91 | -0.496 (-2.072; 1.080) | 0.53 | 4607.04 | ||
| Body muscle percentage | 1 | -0.266 (-0.919; 0.387) | 0.42 | 0.056 (-0.596; 0.708) | 0.86 | 1 | 4682.97 |
| 2 | -0.268 (-0.891; 0.355) | 0.40 | -0.133 (-0.760; 0.494) | 0.57 | 4487.08 | ||
| 3 | -0.112 (-0.783; 0.559) | 0.74 | 0.063 (-0.638; 0.764) | 0.86 | 3528.65 | ||
| Visceral fat level | 1 | -0.214 (-0.668; 0.241) | 0.35 | -0.338 (-0.794; 0.119) | 0.14 | 1 | 4055.22 |
| 2 | -0.191 (-0.642; 0.261) | 0.40 | -0.293 (-0.750; 0.163) | 0.20 | 3938.48 | ||
| 3 | -0.264 (-0.787; 0.259) | 0.32 | -0.526 (-1.073; 0.021) | 0.06 | 3197.92 | ||
4. DISCUSSION
In this cross-sectional study, we investigated the association of various body size and shape measures, both classic and novel, and vitamin D levels by sex in a cohort of Iranian adults. Our findings showed that the association between anthropometric indices and vitamin D levels differed between men and women. BRI and BF% were negatively associated with vitamin D levels in men, particularly in cases of vitamin D deficiency, but this association was not observed in cases of vitamin D insufficiency. In women, anthropometric measurements were not linked to vitamin D levels.
Alongside traditional indicators like BMI for general obesity and WHR for abdominal obesity, new anthropometric measures, such as BRI, ABSI, CI, and AVI, have been proposed. These newer anthropometric measurements, such as BRI, ABSI, CI, and AVI, are accurate predictors of visceral adiposity [15, 23-25]. Body composition measurement parameters provide valuable information about health and various diseases, including obesity. In this study, we also examined VFL, BF%, and BM% of body composition measurements, in addition to these anthropometric measurements. Visceral fat is an endocrine organ that contributes to the development of metabolic abnormalities associated with abdominal obesity [26].
In our findings, WHtR showed a weak inverse association with vitamin D in men after adjusting for age, physical activity, hypertension, and DM. However, in the final model, none of the BMI, WHR, and WHtR indicators showed significant associations with vitamin D in either sex. Different studies reported conflicting results. One study examining the association between vitamin D and subsequent annual changes in body weight or waist circumference (modified by genetic variants) found almost no association [27]. Conversely, another recent study reported that WHR and WHtR were inversely associated with vitamin D levels, while BMI was not significantly associated in men [28]. A prospective study showed a borderline association between insufficient vitamin D at baseline and increased waist circumference and weight (with age control) among men, but not in women [29]. Additionally, a cross-sectional study of subjects aged 37–47 found that vitamin D levels were lower in obese individuals compared to those with normal weight in both the total population and men, but this difference was not significant in women [30]. A study of women with class II/III obesity (BMI ≥ 35 kg/m2) did not show any association between serum vitamin D levels and BMI and WC [31]. Similarly, in a study of postmenopausal women, no association was observed between vitamin D and BMI, WC, and HC indicators [32]. On the other hand, a study among Italians showed that higher BMI, WHR, and WHtR were associated with lower vitamin D levels, especially in women [2]. One of the main factors behind differences in study results is the control of confounding factors and the methodological approaches used. Sex-specific physiological mechanisms could also explain differences between men and women. Specifically, estrogen plays a significant role in obesity development and its pathophysiological consequences in women [33].
Our results indicated that BRI and AVI have an inverse association with vitamin D in men. However, the association for BRI was borderline significant. Although this association was strong for AVI, controlling for additional confounders caused this significance to disappear. The CI and ABSI indices showed no significant association with vitamin D in either sex across all models. Our findings are somewhat similar to previous studies. A cross-sectional study investigated ABSI, CI, and BRI indices and found a negative association between these anthropometrics and vitamin D levels, except for ABSI in women [28]. A study in China reported an inverse association between ABSI and BRI with vitamin D; this association was significant in men but not in women [23]. Another study on Chinese adults reported that ABSI and BRI were weakly associated with lower vitamin D levels [34]. An investigation of individuals aged 65 years and older reported an association between higher BRI and ABSI [35] and lower vitamin D levels [36]. To our knowledge, only one study has investigated the association between AVI and the average dietary intake of vitamin D, and its results showed a weak correlation between vitamin D and AVI [37]. Various factors could explain these discrepancies, including genetic influences that affect serum vitamin D levels and obesity [38, 39]. Due to high costs and difficulties, it is partially impossible to control genetic factors in these studies. Different countries have diverse policies on food fortification with vitamin D [40], and another reason for differences in results across countries could be the lack of control over the consumption of fortified food. Additionally, observed gender differences may relate to women being more sensitive to their body weight and shape, prompting them to engage more in exercise, dieting, supplements, and other weight-control strategies.
In men, our results showed a borderline inverse association between BF% and vitamin D, but no significant association was found for VFL. After adjusting for age, physical activity, DM, and hypertension, BM% showed a strong negative association with vitamin D deficiency. In women, body composition measurements showed no significant association with vitamin D levels. Consistent with our results, some previous studies have reported that BF% is inversely associated with vitamin D [28, 41]. Additionally, a study involving participants aged 55 years and older reported that vitamin D-deficient individuals had a higher BF% [42]. However, a study on women with BMI ≥ 30 kg/m2 stated no association between vitamin D levels and BF% [31]. Furthermore, a study in Caucasian young adults reported no association between vitamin D receptor genes with BF% and VFL [43]. Many prior studies have shown that vitamin D deficiency correlates positively with reduced muscle mass [44, 45]. Several factors can influence serum vitamin D levels, including race and ethnicity, skin pigmentation, latitude and sunlight exposure, outdoor activities, seasonal variation, and diet. These factors are difficult to control and may not be possible in all studies, which could partly explain the inconsistent findings. Another reason for conflicting results may be differences in the instruments and methods used to measure fat distribution, as well as variations in the method and cutoff points for serum vitamin D levels. Sex differences in body composition might also contribute to the disparities between men and women. Men typically accumulate more visceral abdominal fat, leading to the android body shape, while women tend to display gynoid obesity, accumulating more fat in the subcutaneous and gluteal-femoral regions [46].
Generally, many studies suggest possible explanations for the association between vitamin D and Obesity, but the mechanisms remain unclear. One hypothesis is that the hydrophobicity of vitamin D and its trapping in large adipose tissue reduce its availability for additional hydroxylation by the liver and the kidneys [47]. Additionally, Vitamin D accumulation as a fat-soluble vitamin in adipose tissue and volumetric dilution due to large body size lead to lower plasma levels of 25(OH)D in obese individuals [48, 49]. Recent studies indicate that obesity is associated with decreased expression of genes involved in vitamin D metabolism [50, 51]. Another hypothesis is that individuals with obesity may have a different lifestyle, including less outdoor activity and wearing more clothing, which reduces sun exposure [52]. There are various hypotheses on this topic, and opinions differ.
5. STRENGTHS AND LIMITATIONS
In our study, a broad range of anthropometric and body-composition measurements was investigated in a representative sample of the population. For all participants, anthropometric indices, vitamin D levels, and other measurements were obtained by trained researchers using the same equipment and methods. However, our study has limitations, including the inability to accurately control for supplementation and for the season in which vitamin D measurements were taken. Considering the possibility of over-the-counter vitamin D supplements in Iran, there may have been periodic use, especially among women. However, some studies have indicated that the supplement use and the season of vitamin D measurement did not play a significant role in this association [28, 53]. We could not account for participants' skin type or clothing style. Notably, in Iran, women tend to wear a wider variety of clothing styles, which might influence related factors. Additionally, we were unable to control for individuals with a history of bariatric surgery or varying amounts of sunlight exposure. Since our study was cross-sectional, no causal relationships can be established; large-scale prospective studies are needed in the future to clarify the connection between obesity and vitamin D.
CONCLUSION
The present findings indicate that vitamin D status may be inversely associated with certain anthropometric indices, specifically BRI and BF%, among men. However, such associations were not observed in women. These sex-specific differences suggest that biological or behavioral factors may influence vitamin D metabolism across genders. Given these observations, routine evaluation of vitamin D levels, particularly among individuals with obesity, may be beneficial. Nevertheless, these results should be interpreted cautiously, as further studies across diverse populations are necessary to elucidate underlying mechanisms and validate the reproducibility and generalizability of these associations.
AUTHORS’ CONTRIBUTIONS
The authors confirm their contribution to the paper as follows: Study conception and design: RA; Writing the paper: FSS; Analysis and interpretation of results: SJ; Writing - reviewing and editing: MM. All authors reviewed the results and approved the final version of the manuscript.
LIST OF ABBREVIATIONS
| AIC | = Akaike Information Criterion |
| AVI | = Abdominal Volume Index |
| BF% | = Body Fat Percentage |
| BMI | = Body Mass Index |
| BM% | = Body Muscle Percentage |
| BRI | = Body Roundness Index |
| CI | = Confidence Intervals |
| CI | = Conicity Index |
| DM | = Diabetes Mellitus |
| HC | = Hip Circumference |
| SD | = Standard Deviation |
| VFL | = Visceral Fat Level |
| VIFs | = Variance Inflation Factors |
| WC | = Waist Circumference |
| WHR | = Waist-to-Hip Ratio |
| WHtR | = Waist-to-Height Ratio |
| YaHS | = Yazd Health Study |
| 25-OHD | = Serum 25-hydroxy vitamin D |
ETHICS APPROVAL AND CONSENT TO PARTICIPATE
Ethical approval was obtained from the Research Ethics Committee of Shahid Sadoughi University of Medical Sciences, Iran with the Ethical ID IR.SSU.SPH.REC.1402.075.
HUMAN AND ANIMAL RIGHTS
All human research procedures followed were in accordance with the ethical standards of the committee responsible for human experimentation (institutional and national), and with the Helsinki Declaration of 1975, as revised in 2013.
CONSENT FOR PUBLICATION
Written informed consent was obtained from all participants before their inclusion in the study.
AVAILABILITY OF DATA AND MATERIALS
The original data used to support the Findings of this study are available from the corresponding author upon request.
ACKNOWLEDGEMENTS
Declared none.

